15 JavaScript Libraries for Creating Beautiful Charts


It’s practically impossible to imagine any dashboard without graphs and charts. They present complex statistics quickly and effectively. Additionally, a good graph also enhances the overall design of your website.
In this article, I’ll show you some of the best JavaScript libraries for graphs and charts. These libraries will help you create beautiful and customizable charts for your future projects.
While most of the libraries are free and open source, some of them provide a paid version with additional features.
Key Takeaways
- D3.js is a popular and powerful JavaScript library for creating charts, though it has a steep learning curve for beginners. It renders charts via HTML, SVG and CSS.
- Plotly.js is the first scientific JavaScript charting library for the web, supporting 20 chart types, including SVG maps, 3D charts, and statistical graphs. It’s built on top of D3.js and stack.gl.
- Google Charts is a great choice for simple projects that do not require complex customization. It provides many pre-built charts and is rendered using HTML5/SVG for cross-browser compatibility.
- ChartJS provides beautiful flat designs for charts. It uses the HTML5 Canvas element for rendering and supports all modern browsers. Charts are responsive by default and work well on mobile and tablets.
- Other notable JavaScript libraries for creating charts include Chartist.js, Recharts, n3-charts, ZingChart, Highcharts, FusionCharts, Flot, amCharts, CanvasJS, TOAST UI Chart, and AnyChart.
Our top JS charting libraries:
- D3.js – Popular, well supported but a steep learning curve.
- Plot.ly – Great for scientific charting. Built off D3.js.
- Chart.js – Simple and elegant
Other notable mentions:
- Google Charts
- Chartist.js
- Recharts
- n3-charts
- ZingChart
- Highcharts
- Fusion Charts
- Flot
- amCharts
- CanvasJS
- ToastUI
- AnyChart
D3.js — Data-Driven Documents
When we think of charting today, D3.js is the first name that comes up. Being an open source project, D3.js definitely brings many powerful features that were missing in most of the existing libraries. Features like dynamic properties, Enter and Exit, powerful transitions, and syntax familiarity with jQuery make it one the best JavaScript libraries for charting. Charts in D3.js are rendered via HTML, SVG and CSS.
Unlike many other JavaScript libraries, D3.js doesn’t ship with any pre-built charts out of the box. However, you can look at the list of graphs built with D3.js to get an overview. As you can see, D3.js supports a vast variety of chart types.
A drawback for beginners could be its steep learning curve, but there are many tutorials and resources to get you started.
D3.js doesn’t work well with older browsers like IE8 (but who does?). But you can always use plugins like aight plugin for cross-browser compatibility.
If you’d like to learn D3.js, we have a book on data visualization with D3.
Plotly.js
Plotly.js is the first scientific JavaScript charting library for the web. It has been open-source since 2015, meaning anyone can use it for free. Plotly.js supports 20 chart types, including SVG maps, 3D charts, and statistical graphs. It’s built on top of D3.js and stack.gl.
Google Charts
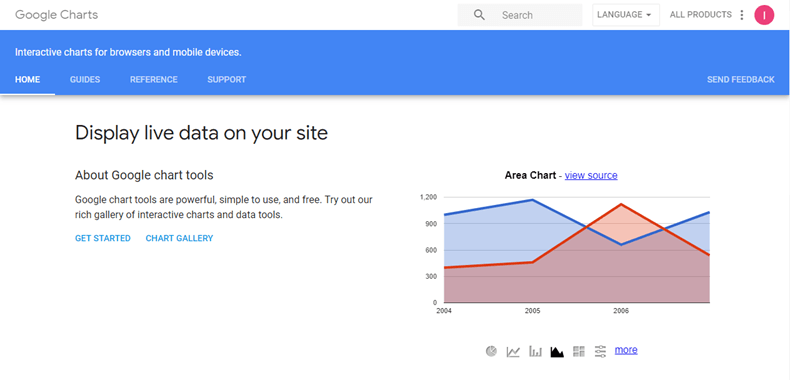
Google Charts is a great choice for simple projects that do not require complex customization. It provides many pre-built charts like area charts, bar charts, calendar charts, pie charts, geo charts, and more. All charts are interactive and you can add them to your page in minutes.
Google Charts also comes with various customization options that help in changing the look of the graph. Charts are rendered using HTML5/SVG to provide cross-browser compatibility and cross-platform portability to iPhones, iPads, and Android. It also includes VML for supporting older IE versions.
Here’s a great list of examples built using Google Charts.
ChartJS
ChartJS provides beautiful flat designs for charts. It uses the HTML5 Canvas element for rendering and supports all modern browsers (IE11+).
ChartJS charts are responsive by default. They work well on mobile and tablets. There are 8 different types of charts out of the box (Line, Bar, Radar, Doughnut and Pie, Polar Area, Bubble, Scatter, Area), plus the ability to mix them. All charts are animated and customizable.
Here is a curated list of examples built with ChartJS.
Chartist.js
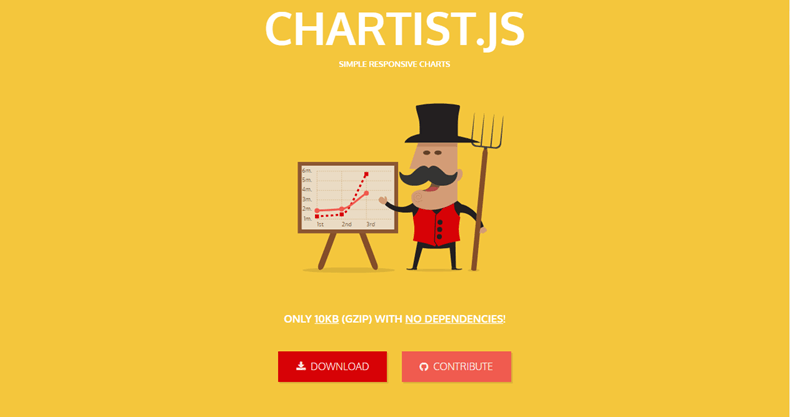
Chartist.js provides beautiful responsive charts. Just like ChartJS, Chartist.js is the product of a community that was frustrated by using highly-priced JavaScript charting libraries. It uses SVG to render the charts. It can be controlled and customized through CSS3 media queries and Sass. Also, note that Chartist.js provides cool animations that will work only in modern browsers.
You can explore and play with different types of charts at the Chartist.js examples page. The charts are interactive and you can edit them on the fly.
Recharts
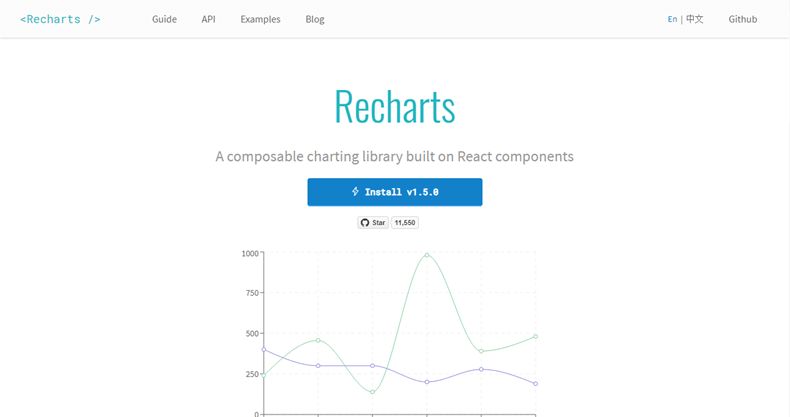
Recharts is a composable charting library for building charts with decoupled, reusable React components. It’s built on top of SVG elements and D3.js. Check out the list of examples.
n3-charts
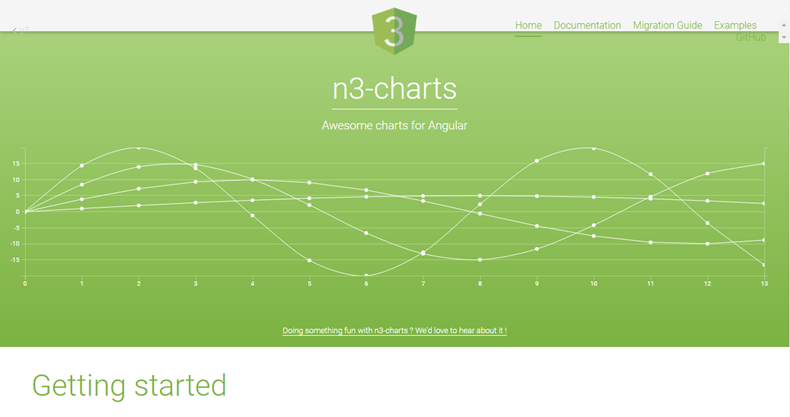
If you are an Angular developer, you will definitely find n3-charts extremely useful and interesting. n3-charts is built on top of D3.js and Angular. It provides various standard charts in the form of customizable Angular directives.
Check out this list of charts built using n3-charts.
ZingChart
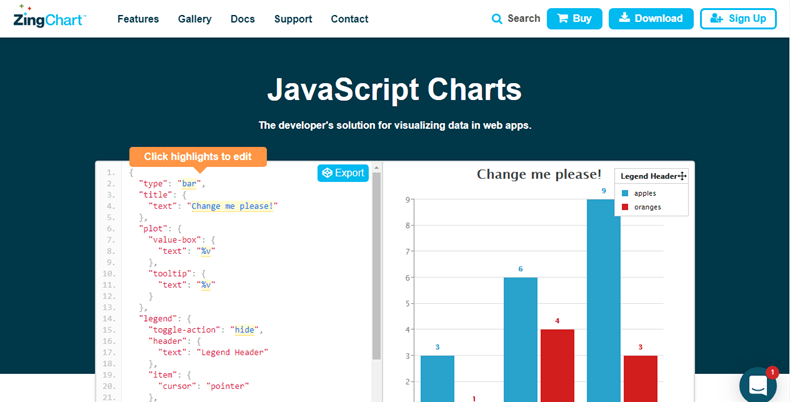
ZingChart offers a flexible, interactive, fast, scalable and modern product for creating charts quickly. Their product is used by companies like Apple, Microsoft, Adobe, Boeing and Cisco, and uses Ajax, JSON, HTML5 to deliver great-looking charts quickly.
ZingChart offers more than 35 responsive chart types and modules, which can also be showing data in real-time. They can be styled and themed by CSS and can render big data fast.
You can check out their rich set of examples.
A branded version, with all charts, is available to try for free, but for watermark-free output you need to buy one of ZingChart’s paid licenses according to your business size.
Highcharts

Highcharts is another very popular library for building graphs. It comes loaded with many different types of cool animations that are sufficient to attract many eyeballs to your website. Just like other libraries, Highcharts comes with many pre-built graphs like spline, area, areaspline, column, bar, pie, scatter, etc. The charts are responsive and mobile-ready. Besides, Highcharts offers some advanced features such as adding annotations to your charts.
One of the biggest advantages of using Highcharts is compatibility with older browsers — even way back to Internet Explorer 6. Standard browsers use SVG for graphics rendering. In legacy Internet Explorer, graphics are drawn using VML.
There are wrappers for most popular languages (.NET, PHP, Python, R, and Java) and frameworks (Angular, Vue and React), and for iOS and Android.
While Highcharts is free for personal use, you need to purchase a license for commercial usage.
FusionCharts
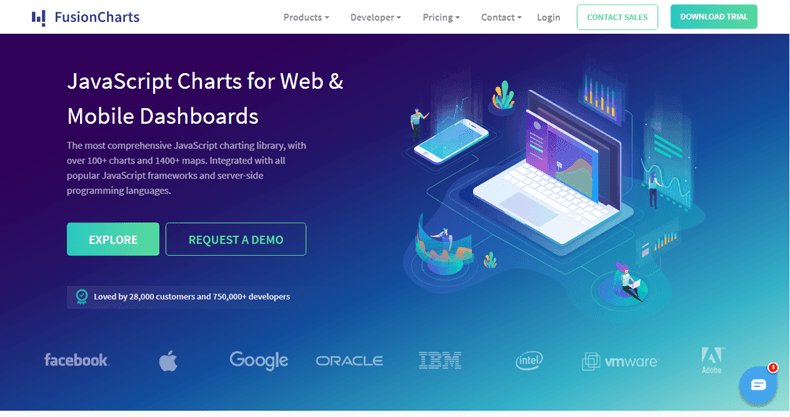
FusionCharts is one of the oldest JavaScript charting libraries, released way back in 2002. With over 100+ charts and 1400+ maps, it’s easy to say that FusionCharts is the most comprehensive JavaScript charting library. It offers integrations with all popular JavaScript frameworks and server-side programming languages. Charts are rendered using HTML5/SVG and VML for better portability and compatibility with older browsers — even way back to Internet Explorer 6. This backwards compatibility made it a very popular choice for a long time. You can export the charts in JPG, PNG, SVG, and PDF formats.
You can use the watermarked version of FusionCharts for free in personal projects. However, you need to purchase a commercial license to remove the watermark.
Flot
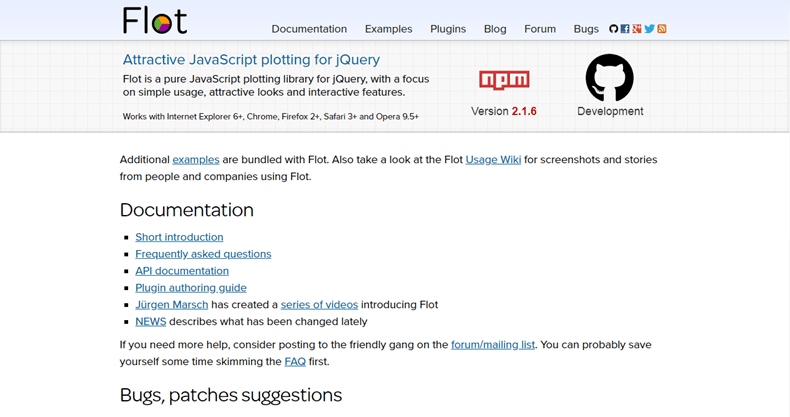
Flot is a JavaScript charting library for jQuery. It is also one of the oldest and most popular charting libraries.
Flot supports lines, points, filled areas, bars and any combinations of these. It’s also compatible with older browsers — way back to IE6 and Firefox 2.
Flot is completely free to use. Here’s a list of example graphs created using Flot.
amCharts
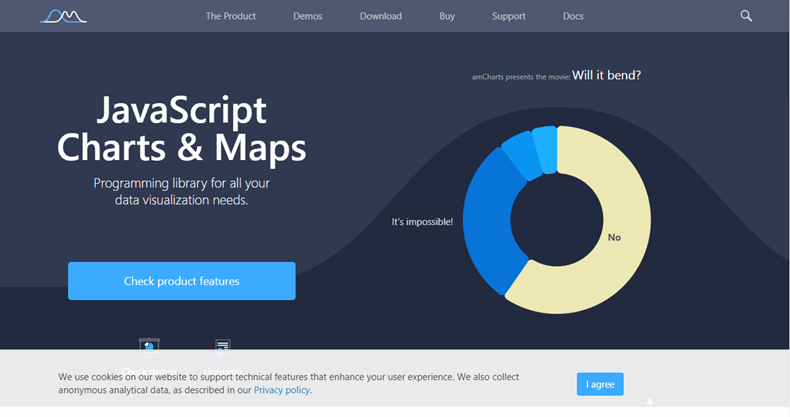
amCharts is undoubtedly one of the most beautiful charting libraries out there. It offers both charts and geographical maps (Map Chart), which allow for advanced data visualization.
The Map Chart package is very impressive. It allows you to create all kinds of interactive maps with a few lines of code. Some of the great features this package provides include map projections, coordinate shifting, and heat maps. There are lots of bundled maps and you can make your own too.
amCharts uses SVG to render charts that work in all modern browsers. It provides integrations with TypeScript, Angular, React, Vue and plain JavaScript apps.
Checkout this fantastic collection of cool demos created using amCharts.
The free version of amChart will leave a backlink to its website on the top of every chart.
CanvasJS
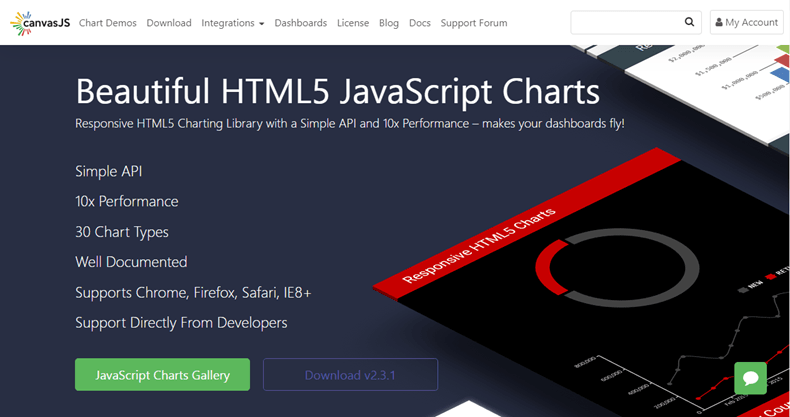
CanvasJS is a responsive HTML5 charting library with high performance and a simple API. It supports 30 different chart types (including line, column, bar, area, spline, pie, doughnut, stacked charts, etc.), which are well documented. All charts include interactive features like tooltips, zooming, panning, animation, etc. CanvasJS can be integrated with popular frameworks (Angular, React, and jQuery) and server-side technologies (PHP, Ruby, Python, ASP.Net, Node.JS, Java).
Here’s an interactive collection of CanvasJS chart examples.
TOAST UI Chart
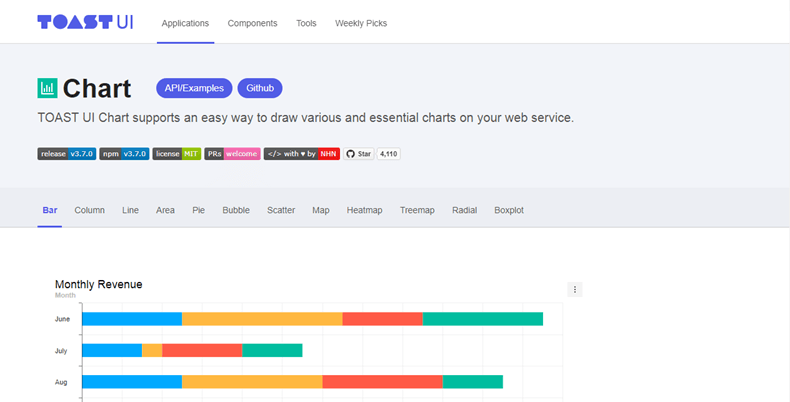
TOAST UI Chart is an open source JavaScript charting library with support for legacy browsers including IE8. It includes all common chart types and maps, which can be customized with user-defined themes. The charts can be also combined in combo charts, for example column with line or line with area, etc. Check out the full list of examples.
AnyChart
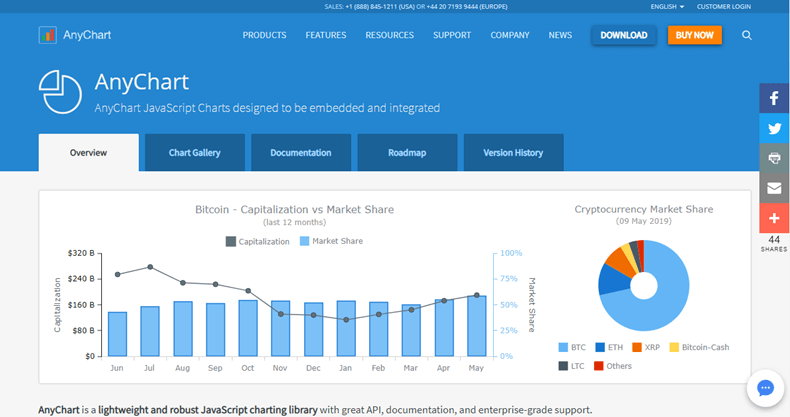
AnyChart is a lightweight and robust JavaScript charting library with charts designed to be embedded and integrated. AnyChart allows you to display 68 charts out-of-the-box and provides features to create your own chart types. You can save a chart as an image in PDF, PNG, JPG or SVG format.
AnyChart provides users with five types of resources to learn the library (documentation, API Reference, Playground, Chartopedia, and FAQ).
You can download a watermarked version for free after registration. However, to get rid of the branding and use AnyChart for commercial purposes, it’s necessary to buy a license.
Conclusion
It now depends on you to select the best charting library for your future projects. Developers who like to have complete control over their charts will definitely opt for D3.js. Almost all the above libraries have good support via Stack Overflow forums.
If you are looking for tools to generate ready-made charts, head over to 5 Tools for Creating Amazing Online Charts article. You can also read Creating Simple Line and Bar Charts Using D3.js to get started with D3.js. We also have a dedicated series on using Google Charts with Angular, and a book: An Introduction to Data Visualization with D3.
There are lots of other charting and graphing libraries out there. Here are some more worth checking out:
- GoJS is a JavaScript diagramming library for interactive flowcharts, org charts, design tools, planning tools, visual languages.
- C3.js is a D3-based reusable chart library.
- dimple is an object-oriented API for business analytics powered by D3.
- Charted, by Medium, is a tool that automatically visualizes data. You just give it a link to a data file. (You can read more about it at Medium.)
- Smoothie Charts can be helpful, if you are dealing with stream real-time data.
- Chartkick.js is a library that allows you to create beautiful charts with one line of JavaScript.
- Morris.js is a powerful library with a clean interface. It allows you to create good-looking charts with ease. It’s based on jQuery and the Raphaël JavaScript library.
Lastly, here are some simpler tools for quickly creating infographics:
- infogram makes it easy to create engaging infographics and reports in minutes.
- Piktochart is a simple, intuitive tool that helps you represent various kind of data.
- Easelly is a simple infographic maker that lets you visualize any kind of information.
If you need to improve your JavaScript skills, you can also check out various JavaScript books in our library.
FAQs About JavaScript Libraries for Charts
What are the JavaScript libraries for graphs?
JavaScript offers several libraries and frameworks for creating interactive graphs and visualizing data. One of the most versatile and widely used options is D3.js (Data-Driven Documents). D3.js allows for complete control over the DOM, enabling the creation of custom and interactive data visualizations. It’s especially suitable for complex and highly customized graphing needs.
For those looking for a simpler and more user-friendly option, Chart.js is a lightweight library that offers various chart types, including line charts, bar charts, and pie charts. Chart.js is known for its ease of use and quick setup, making it a popular choice for developers who want to create simple, responsive graphs without extensive configuration.
Another noteworthy library is Plotly, which combines the power of D3.js with a higher-level, user-friendly interface. Plotly is great for creating interactive graphs and supports both JavaScript and Python, making it a versatile choice for web and desktop applications. When selecting a library, consider your specific project requirements, the level of customization needed, and ease of integration with your chosen technology stack.
There are many more lbraries available, though: our favorites are oultined above!
What is better than Chart.js?
Chart.js is excellent for creating straightforward, standard charts with relative ease, but several alternatives offer distinct advantages for specific use cases.
If you require highly customized and interactive charts, D3.js (Data-Driven Documents) stands out. It provides unparalleled control over your visualizations, allowing you to build intricate and unique graphs. However, it comes with a steeper learning curve compared to Chart.js, making it ideal for more complex data visualization projects.
Highcharts is a commercial library that excels in offering a rich array of features and advanced chart types. If you have a budget for a commercial library, Highcharts can be a compelling choice, providing a wider range of charting capabilities beyond what Chart.js offers.
For a balance between interactivity and ease of use, Plotly is a strong contender. It empowers developers to create interactive charts swiftly and supports both JavaScript and Python, enhancing its versatility across different platforms. Plotly is particularly beneficial when you need to rapidly develop interactive visualizations without diving deep into the intricacies of D3.js.
What is the difference between Chart. js and D3.js?
Chart.js and D3.js serve different purposes in the realm of data visualization. Chart.js is geared towards simplicity and ease of use. It provides a high-level API that enables developers to create common chart types quickly and with minimal code. It’s an excellent choice for projects where you need straightforward visualizations without diving into the intricacies of low-level chart rendering. On the other hand, D3.js is a more advanced and flexible library that offers fine-grained control over the Document Object Model (DOM). It follows a “data-driven” approach, giving developers the power to create highly customized and interactive visualizations. However, this flexibility comes at the cost of a steeper learning curve.
The key difference lies in complexity and customization. Chart.js is best suited for simple and standard charts, making it perfect for rapid development of common data visualizations. In contrast, D3.js excels when you need intricate, tailored visualizations or when you want complete control over every aspect of the visualization’s behavior and appearance. The choice depends on your project’s requirements: Chart.js for quick and straightforward tasks, and D3.js for projects demanding extensive customization and interactivity.
What is the difference between Chart.js and Highcharts?
hart.js and Highcharts are both JavaScript libraries for creating interactive charts and graphs, but they have important distinctions. First, licensing: Chart.js is open-source and freely available under the MIT license, making it a cost-effective choice for a wide range of projects. Highcharts, while offering a free version for non-commercial use, requires a commercial license for most business applications. It’s a consideration for organizations with budgets that can accommodate commercial software.
In terms of customization and features, Chart.js is celebrated for its simplicity and ease of use, making it ideal for quickly creating basic charts. It provides a moderate level of customization but may have limitations compared to more robust charting libraries like Highcharts. Highcharts, conversely, boasts a rich feature set and extensive customization options. It supports a wide array of chart types, interactive features, and built-in animations. It’s the go-to choice when intricate, feature-rich charts with advanced interactivity are needed.
Lastly, the community and ecosystem differ. Chart.js has a thriving community and active development, providing ample resources, plugins, and support. It’s a popular choice among developers for its versatility and free availability. Highcharts also maintains a strong community, offering comprehensive documentation and support. However, as a commercial product, the ecosystem might not be as extensive as open-source alternatives like Chart.js, potentially limiting the availability of free resources and plugins.
What is the simplest JavaScript chart library?
If you’re seeking the simplest JavaScript chart library for basic charting needs, Chart.js stands out as an accessible choice. It offers an intuitive API for creating common chart types like line charts, bar charts, and pie charts with minimal code. This library is particularly beginner-friendly and ideal for developers who want quick and uncomplicated solutions for visualizing data.
Another straightforward option is Google Charts, which is renowned for its ease of use. It provides a simple API and a variety of chart types, making it suitable for those who prefer a hassle-free experience. Google Charts also integrates seamlessly with Google’s suite of tools, which can be advantageous when working within that ecosystem.
Flot is a lightweight and user-friendly library tailored for interactive chart creation. It’s known for its simplicity in setup and usage, making it a convenient choice for developers looking to swiftly incorporate interactive charts into web applications without a steep learning curve.
I am a web developer/designer from Bulgaria. My favorite web technologies include SVG, HTML, CSS, Tailwind, JavaScript, Node, Vue, and React. When I'm not programming the Web, I love to program my own reality ;)
Web Designer with over 6 years of experience, including user experience and front end development. Currently, CEO and Co-Founder of Hashnode, a network of software developers. Has published two books: Jump Start Bootstrap and Jump Start Foundation for SitePoint Premium.