Monitoring WordPress Apps with the ELK Stack


Key Takeaways
- Monitoring WordPress applications can be a challenge due to the need to analyze various logs such as WordPress and PHP logs, web server logs, and database logs. The ELK Stack (Elasticsearch, Logstash, Kibana) provides a centralized logging system that pulls logs from various sources for analysis and visualization.
- The first step in monitoring WordPress apps with the ELK Stack is to configure WordPress to write logs. This involves changing the WP_DEBUG value to true, enabling the WordPress logging feature, and potentially using other options such as the SAVEQUERIES definition.
- The logs are then shipped to the ELK Stack for analysis using Filebeat, a log shipper by Elastic. Filebeat tails log files and sends the traced data to Logstash or Elasticsearch. The logs can be further parsed using the grok plugin in Logstash to make them more readable and easy to analyze.
- The ELK Stack allows for the visualization of log data in Kibana, making it easier to understand and analyze. This data can be used to create a monitoring dashboard for a general overview of the WordPress app environment. Custom logs can also be written for future ingestion into ELK using the error_log() function.
WordPress is an amazing piece of engineering. There’s little wonder that more than a quarter of all CMS-based websites are using it. In reality, though, WordPress sites crash just like any other site. Bad plugins or themes causing the “WordPress screen of death”, or WordPress updates going south, are an all too frequent occurrence.

When something does go wrong, one of the first things you’re going to want to look at are the log files. Not because you enjoy it — log files are not easy to decipher — but because they contain valuable information that can shed light on what exactly occurred.
In modern environments however, this task is a challenge. While WordPress admins might not ever need to hear the word “log”, the web developers and DevOps crews running the site will often need to go through lines after lines of log files to understand what went wrong.
“So, what’s new?” you might ask. After all, there are plenty of WordPress plugins such as WP Log Viewer that enable you to view these logs easily from the WordPress admin panel.
While this is true, analyzing WordPress and PHP logs is simply not enough. There are also web server and database logs to sift through. To successfully query huge volumes of log messages coming in from various sources and identify correlations, a more solid solution is required.
Enter the ELK Stack. The most popular and fastest-growing open source log analytics platform, ELK allows you to build a centralized logging system that can pull logs from as many sources as you define and then analyze and visualize this data.
To show an example of using ELK, this article will go through the steps of establishing a pipeline of logs from your WordPress application into the Logz.io ELK Stack. You can, if you like, use any instance of the stack to perform the exact same procedures.
Enabling Logging for WordPress Apps
The first step is to configure WordPress to write logs. To do this we are going to enter some definitions in our wp-config file.
First, we will change the WP_DEBUG value to true:
define( 'WP_DEBUG', true );
You’ll now start seeing PHP errors, notices and warnings, as well as WordPress debug messages, on your app’s pages.
Next, we will enable the WordPress logging feature:
define( 'WP_DEBUG_LOG', true );
This will save all of the error messages to a debug.log file located in the /wp-content/ directory of your app.
If you don’t want the error messages to be displayed on your app’s pages, use WP_DEBUG_DISPLAY — this is another constant that allows you to control whether WP_DEBUG messages are shown inside the HTML of your site. To change the default behavior that displays the errors on-screen, change the value to false to hide all messages:
define( 'WP_DEBUG_DISPLAY', false );
Another useful option is the SAVEQUERIES definition, which saves database queries to an array. You can then use this array to help analyze the issues:
define( 'SAVEQUERIES', true );
Each query will be saved along with information on how long the query took to execute, and the function that called it.
Save your configuration.
You’re all set! To verify the creation of the debug.log file, simulate an error (you can use the error_log() function) and then locate and open the file. If the file is not there, you have not triggered an error yet.
Of course, using WP_DEBUG is not recommended in production, so be careful with how you use it and what definitions you are using (the SAVEQUERIES definition, for example, can slow down your site considerably).
Shipping the Logs to ELK
Now that we’ve enabled logging for our WordPress app, the next step is to take our new log file and ship it together with Apache logs to the ELK Stack for analysis. To do this, we will use Filebeat, a log shipper by Elastic that tails log files, and sends the traced data to Logstash or Elasticsearch.
Installing Filebeat
I’m running Ubuntu 14.04, and I’m going to install Filebeat from the repository (if you’re using a different OS, here are additional installation instructions).
First, I’m going to download and install the Public Signing Key:
curl https://packages.elasticsearch.org/GPG-KEY-elasticsearch | sudo apt-key add -
Next, I’m going to save the repository definition to /etc/apt/sources.list.d/beats.list:
echo "deb https://packages.elastic.co/beats/apt stable main" | sudo tee -a /etc/apt/sources.list.d/beats.list
Finally, I’m going to run apt-get update and install Filebeat:
sudo apt-get update && sudo apt-get install filebeat
Logz.io uses TLS as an added security layer, so our next step before configuring the data pipeline is to download a certificate and move it to the correct location:
wget http://raw.githubusercontent.com/cloudflare/cfssl_trust/master/intermediate_ca/COMODORSADomainValidationSecureServerCA.crt
sudo mkdir -p /etc/pki/tls/certs
sudo cp COMODORSADomainValidationSecureServerCA.crt /etc/pki/tls/certs/
Configuring Filebeat
Our next step is to open the Filebeat configuration file at /etc/filebeat/filebeat.yml and configure Filebeat to track specific log files and output them to the Logz.io Logstash instance.
In the Prospectors section, we will define the files we want Filebeat to tail: in this case, our Apache log files (/var/log/apache2/*.log) as well as the WordPress debug file (/var/www/html/wordpress/wp-content/debug.log). If you’re using Nginx, alter accordingly.
For each prospector we will define a log type (Apache, WP) — this helps to differentiate between the various log messages as they begin to pile up in our ELK system and will allow us to analyze them more easily.
We will also add some additional Logz.io-specific fields (codec and user token) to each prospector.
The configuration looks as follows:
################### Filebeat Configuration Example #########################
############################# Filebeat #####################################
filebeat:
  # List of prospectors to fetch data.
  prospectors:
    # This is a text lines files harvesting definition
    -
     paths:
       - /var/www/html/wordpress/wp-content/debug.log
     fields:
       logzio_codec: plain
       token: tWMKrePSAcfaBSTPKLZeEXGCeiVMpuHb
     fields_under_root: true
     ignore_older: 24h
     document_type: WP
    -
    paths:
       - /var/log/apache2/*.log
    fields:
      logzio_codec: plain
      token: tWMKrePSAcfaBSTPKLZeEXGCeiVMpuHb
    fields_under_root: true
    ignore_older: 24h
    document_type: apache
    registry_file: /var/lib/filebeat/registry
Next, in the Output section of the configuration file, we will define the Logz.io Logstash host (listener.logz.io:5015) as the output destination for our logs, and the location of the TLS certificate used for authentication.
############################# Output ########################################
# Configure what outputs to use when sending the data collected by the beat.
output:
  logstash:
    # The Logstash hosts
    hosts: ["listener.logz.io:5015"]
    tls:
      # List of root certificates for HTTPS server verifications
      Certificate_authorities: ['/etc/pki/tls/certs/COMODORSADomainValidationSecureServerCA.crt']
Now, if you are using the open source ELK stack, you can ship directly to Elasticsearch or use Logstash. The configuration for either of these outputs in this case is straightforward:
Output:
  logstash:
    hosts: ["localhost:5044"]
  elasticsearch:
    hosts: ["localhost:9200"]
Save your Filebeat configuration.
Configuring Logstash
Logstash, the component in the stack in charge of parsing the logs before forwarding them to Elasticsearch, can be configured to manipulate the data to make the logs more readable and easy to analyze.
In our case, we’re going to use the grok plugin to parse our WordPress logs. Now, if we’re using Logz.io, grokking is taken care of for us. But if you’re using the open source ELK, simply apply the following configuration directly to your Logstash configuration file (/etc/logstash/conf.d/xxxx.conf):
if [type] == "WP" {
    grok {
        match => [
            "message", "\[%{MONTHDAY:day}-%{MONTH:month}-%{YEAR:year} %{TIME:time} %{WORD:zone}\] PHP %{DATA:level}\:  %{GREEDYDATA:error}"
            ]
    }
    mutate {
        add_field => [ "timestamp", "%{year}-%{month}-%{day} %{time}" ]
        remove_field => [ "zone", "month", "day", "time" ,"year"]
    }
    date {
        match => [ "timestamp" , "yyyy-MMM-dd HH:mm:ss" ]
        remove_field => [ "timestamp" ]
    }
  }
Verifying the Pipeline
It’s time to make sure the log pipeline into ELK is working as expected.
First, make sure Filebeat is running:
cd /etc/init.d
./filebeat status
And if not, enter:
sudo ./filebeat start
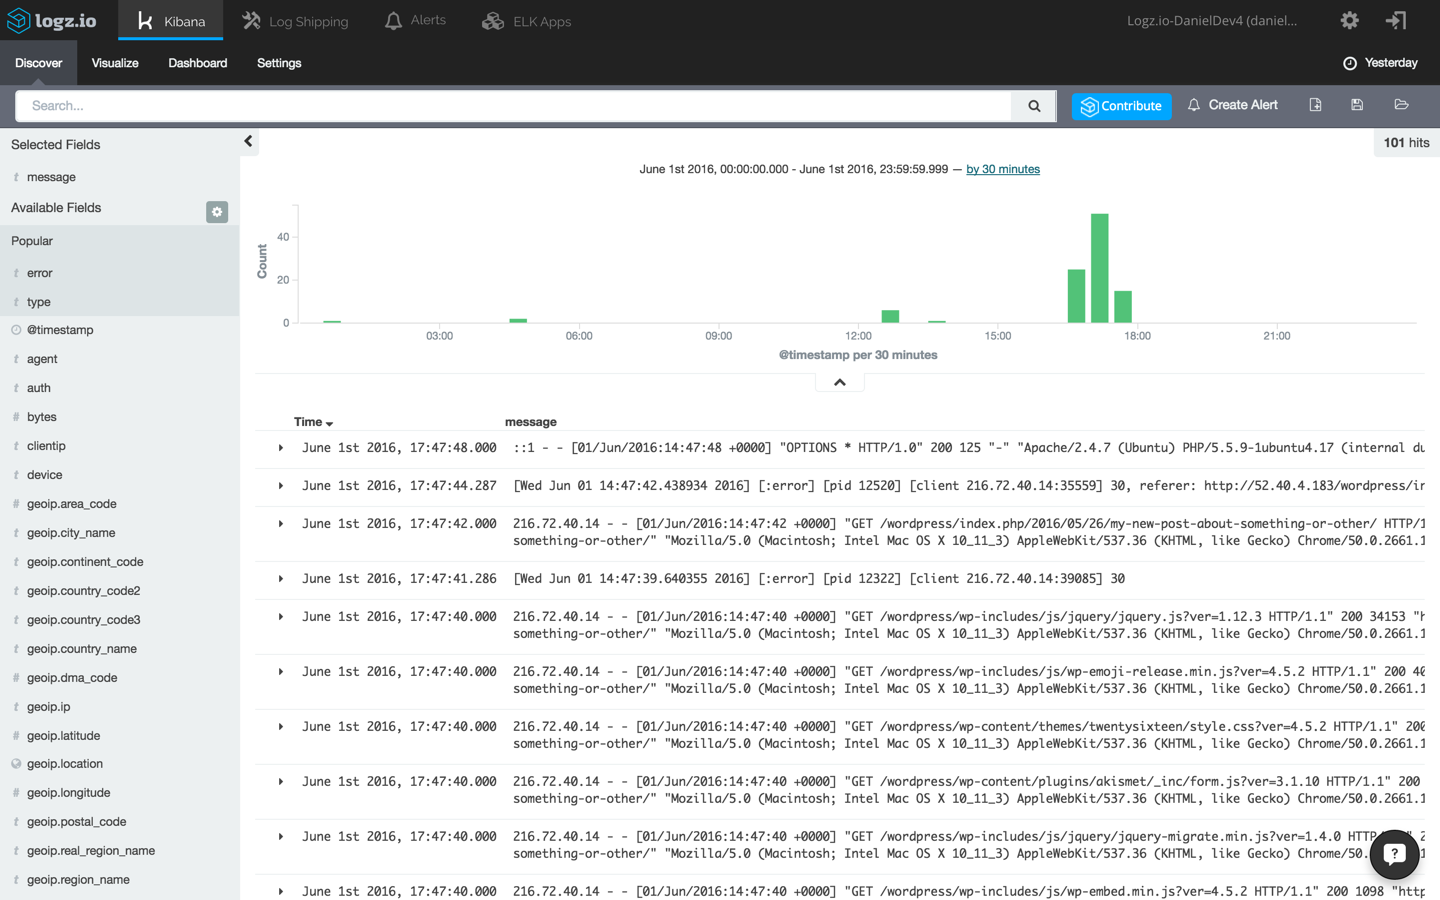
Next, open up Kibana (integrated into the Logz.io user interface). Apache logs and WordPress errors will begin to show up in the main display area.
Analyzing the Logs
ELK is designed for big data. As such, the platform allows you to sift through large volumes of messages being ingested by querying the storage component of the stack — Elasticsearch.
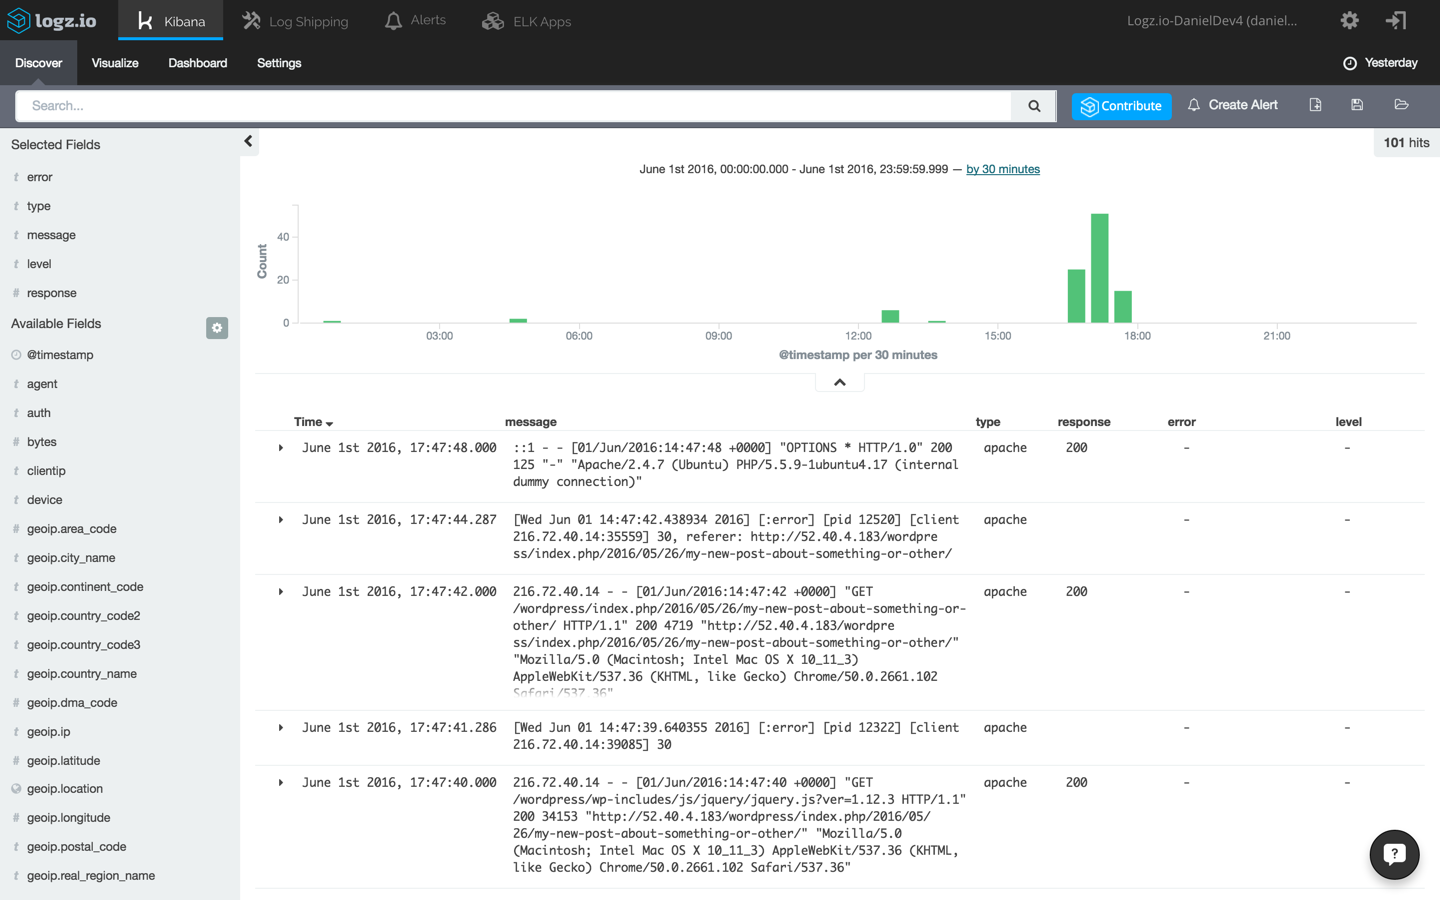
To start making sense of the data, select one of the messages in the main display area — this will give you an idea on what information is available. Remember the different type we defined for the Filebeat prospectors? To make this list of messages more understandable, select the type, response, level and error fields from the list of mapped fields on the left.
Now, say you’d like to filter the results to only see messages coming in from the WordPress debug.log file. There are a number of ways to do this, the easiest being entering the following field-level query in the Kibana query field at the top of the page:
type:WP
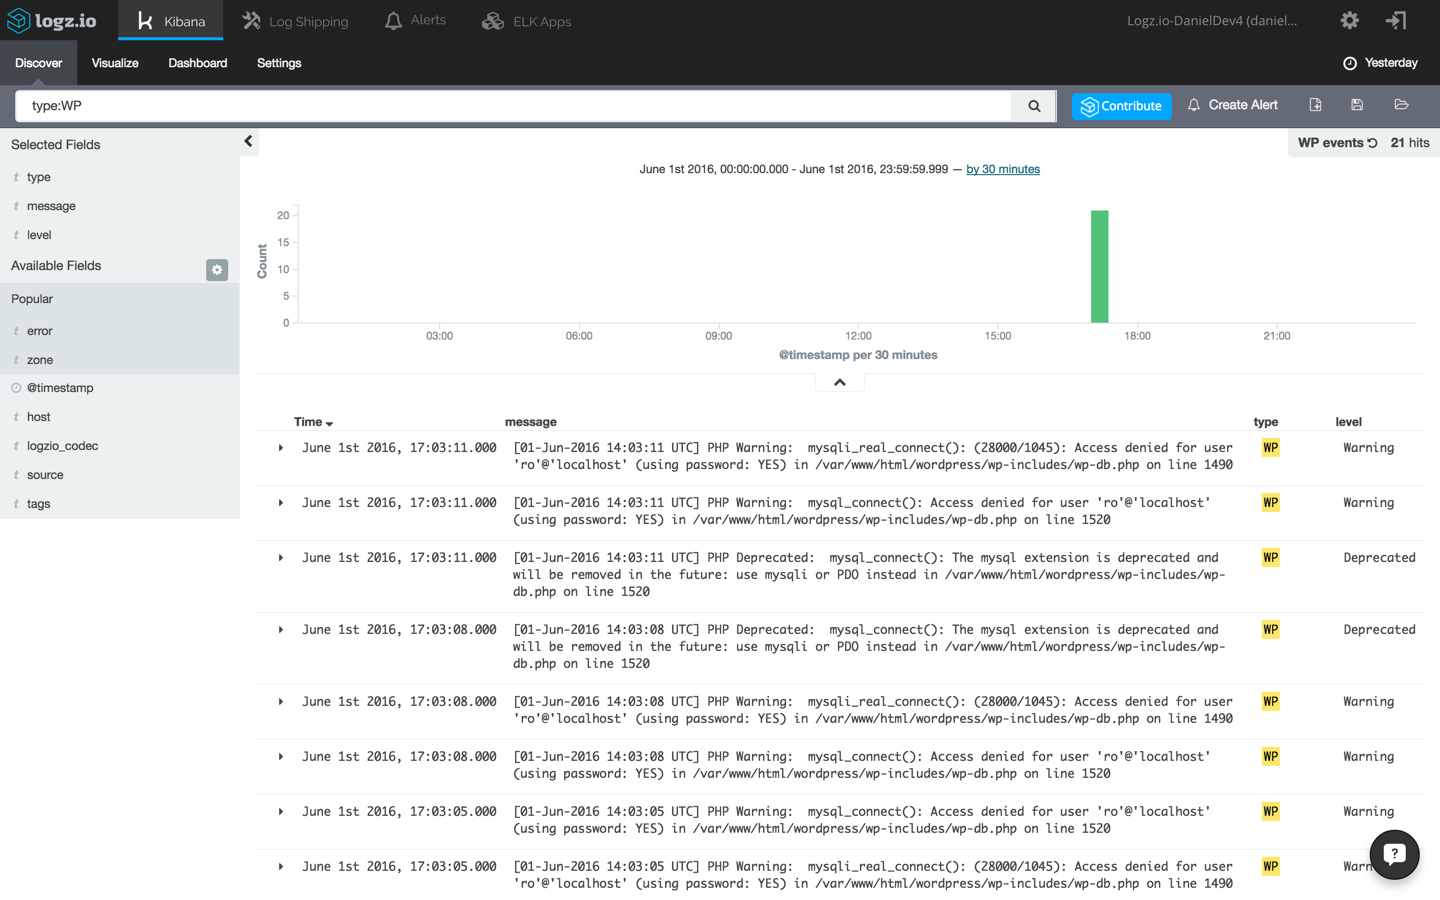
Again, open one of the messages and view the information that has been shipped into the system. Here’s an example of a database error logged by PHP into the debug.log file and forwarded into the ELK Stack:
[01-Jun-2016 14:03:11 UTC] PHP Warning: mysqli_real_connect(): (28000/1045): Access denied for user 'ro'@'localhost' (using password: YES) in /var/www/html/wordpress/wp-includes/wp-db.php on line 1490
Save the search. We will use it to create a visualization in the next step.
Visualizing the Logs
Our next step is to try and create a graphic depiction of the data by creating a new Kibana visualization. As an example, we’re going to create a piechart giving us a breakdown of the different PHP and WordPress errors logged.
Select the Visualize tab in Kibana, and from the selection of available visualizations, select the Pie Chart visualization type.
Next, select to create the visualization based on our saved search above, and configure it as follows:
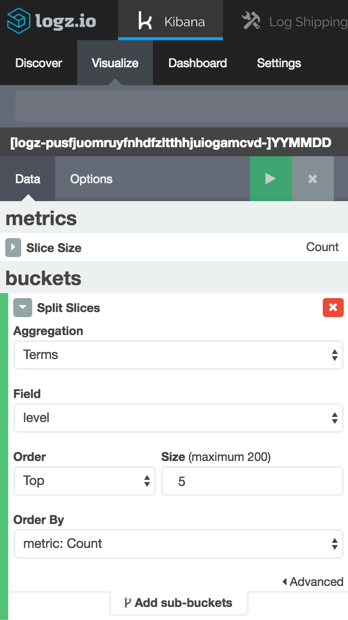
We’re using a simple term aggregation using the level field to show a count for the top 5 error types. Hit the green Play button to see a preview of the visualization:
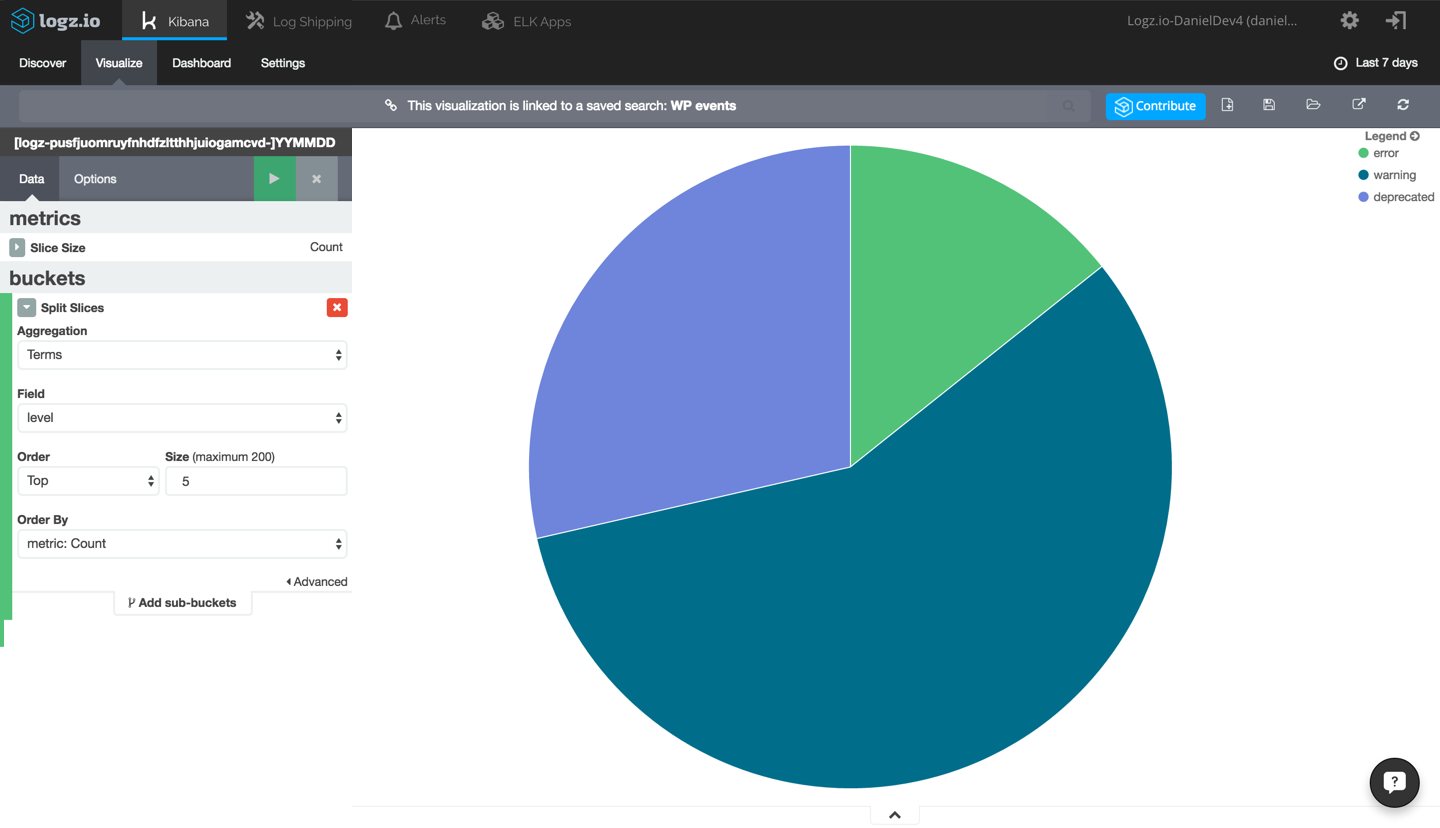
This is a simple example of how your WordPress log data can be visualized in Kibana. The same applies to your Apache logs and any other data source you configure to integrate with ELK, and once you have a series of visualizations for monitoring your WordPress app, you can add them up to create a dashboard giving you a general overview of your environment.
Writing Custom Logs
Another option is to write your own logs to the log file.
Log-driven development (LDD) is a development methodology incorporated into the DevOps culture that is based on developers writing and monitoring logs as an integral part of their development process.
Using the error_log() function, you can write custom messages into the WordPress log file for future ingestion into ELK. Examples of using this function could be for monitoring when a certain line of code is read or even when a specific page is visited.
Final Note
Being able to centralize the logging of all the components and services your app relies on is key to keeping tabs on your environment, especially if your app is running on a cloud infrastructure in which multiple services are running behind a hidden veil.
While WordPress supports various logging plugins, none offer the ability to correlate logs with additional data sources such as the web server, database, or load balancer. Centralized logging with ELK allows you to do just that — together with the ability to analyze the data and create monitoring dashboards to help you visualize it.
Frequently Asked Questions about Monitoring WordPress Apps with the ELK Stack
What is the ELK Stack and why is it important for monitoring WordPress applications?
The ELK Stack is a collection of three open-source products: Elasticsearch, Logstash, and Kibana, all developed and maintained by Elastic. Elasticsearch is a search and analytics engine, Logstash is a server-side data processing pipeline that ingests data from multiple sources simultaneously, and Kibana lets users visualize data with charts and graphs in Elasticsearch. The ELK Stack is important for monitoring WordPress applications because it provides real-time insights into the performance and health of your applications. It allows you to analyze large volumes of data quickly and efficiently, helping you identify and resolve issues before they impact your users.
How does the ELK Stack compare to other WordPress monitoring tools?
The ELK Stack stands out from other WordPress monitoring tools due to its comprehensive data analysis capabilities. While other tools may provide basic monitoring features, the ELK Stack offers a more in-depth look at your application’s performance. It allows you to collect, analyze, and visualize data in real-time, providing actionable insights that can help you improve your application’s performance and user experience.
Is it difficult to set up the ELK Stack for WordPress monitoring?
Setting up the ELK Stack for WordPress monitoring can be a bit complex if you’re not familiar with the technology. However, with the right guidance and resources, it’s certainly manageable. Our article provides a step-by-step guide on how to set up the ELK Stack for WordPress monitoring, making the process easier for you.
Can I use the ELK Stack to monitor multiple WordPress applications?
Yes, the ELK Stack can be used to monitor multiple WordPress applications. You can set up separate indices for each application in Elasticsearch, allowing you to analyze and visualize data for each application separately in Kibana.
What kind of data can I monitor with the ELK Stack?
With the ELK Stack, you can monitor a wide range of data related to your WordPress application. This includes server logs, application logs, user activity data, performance metrics, and more. By analyzing this data, you can gain valuable insights into your application’s performance and user behavior.
How can I visualize my WordPress data using Kibana?
Kibana provides a variety of visualization options for your WordPress data. You can create charts, graphs, maps, and more to visualize your data in a way that makes sense for you. Our article provides a detailed guide on how to use Kibana for data visualization.
Can the ELK Stack help me identify and resolve issues in my WordPress application?
Absolutely. The ELK Stack’s real-time data analysis capabilities can help you identify issues in your WordPress application as soon as they occur. By analyzing your application’s logs and performance metrics, you can pinpoint the root cause of issues and resolve them quickly, minimizing their impact on your users.
Is the ELK Stack suitable for large-scale WordPress applications?
Yes, the ELK Stack is highly scalable and can handle large volumes of data, making it suitable for large-scale WordPress applications. Elasticsearch, the core component of the ELK Stack, is designed to be distributed and can scale horizontally to handle large data sets.
How secure is the ELK Stack for WordPress monitoring?
The ELK Stack provides several security features to protect your WordPress data. This includes data encryption, user authentication, role-based access control, and more. However, like any technology, it’s important to follow best practices for data security when using the ELK Stack.
Can I customize the ELK Stack to suit my specific WordPress monitoring needs?
Yes, the ELK Stack is highly customizable. You can configure Elasticsearch to collect specific types of data, use Logstash to process and transform your data in various ways, and create custom visualizations in Kibana to analyze your data in the way that best suits your needs.
Product Evangelist at Logz.io. Author and blogger. Write about PHP, ELK, Log Analytics and BigData. Family man, runner and Liverpool FC fan.
Published in
·automation·Cloud·Debugging & Deployment·Development Environment·Patterns & Practices·PHP·September 24, 2017