
In the context of user interface design, red typically means “no” or “error” in Western cultures. But why can’t it mean something positive instead? Well, actually, in Asian cultures, red symbolizes longevity, celebration, happiness and prosperity. Brides wear red dresses at their wedding, and receive monetary gifts in red envelopes. That’s a far cry from “no” or “error”.
Color matters. Color has meaning. Color helps users make decisions faster, because color indicates what the result of an interaction will be.
Consider a green button with the word “No”. Now, in Western cultures, this is very confusing, because the green is indicating “yes” while really saying “no”. If we were to rush into this (as users often do), we might even click the green button while completely misunderstanding what it means to do so.
In Asian cultures, red doesn’t typically indicate “no”, so using red in UI design might result in the user making unintentional mistakes. But of course, there are exceptions. Pinterest uses red in their branding for example, but we can quickly decipher this since red is used all over their website (logo, icons, buttons, etc.). Context matters. Also, what means something in a certain culture might not always ring true for UI design specifically.
We’ll chat a little more about the diagnostic side of things later. For now, let’s learn how to find out where our users are from, using Google Analytics.
Location Demographics
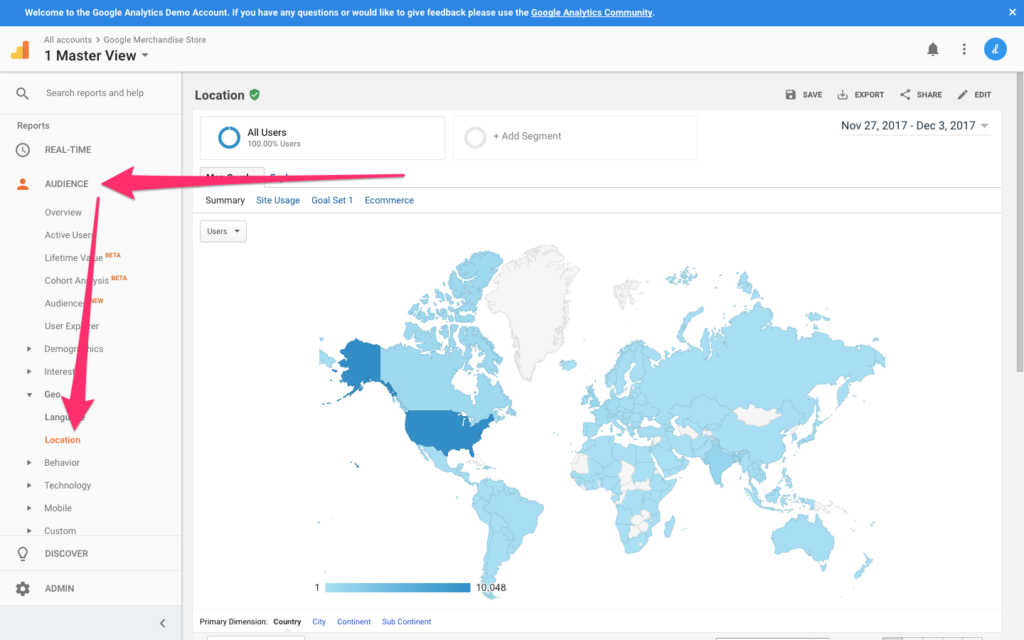
In the Google Analytics sidebar where the five types of reports are listed (Real-Time, Audience, Acquisition, Behavior, Conversions), choose Audience → Geo → Location. As with most reports, an overview is the first thing you’ll see. For Geo → Location reports, this overview is a map.
Getting realistic data
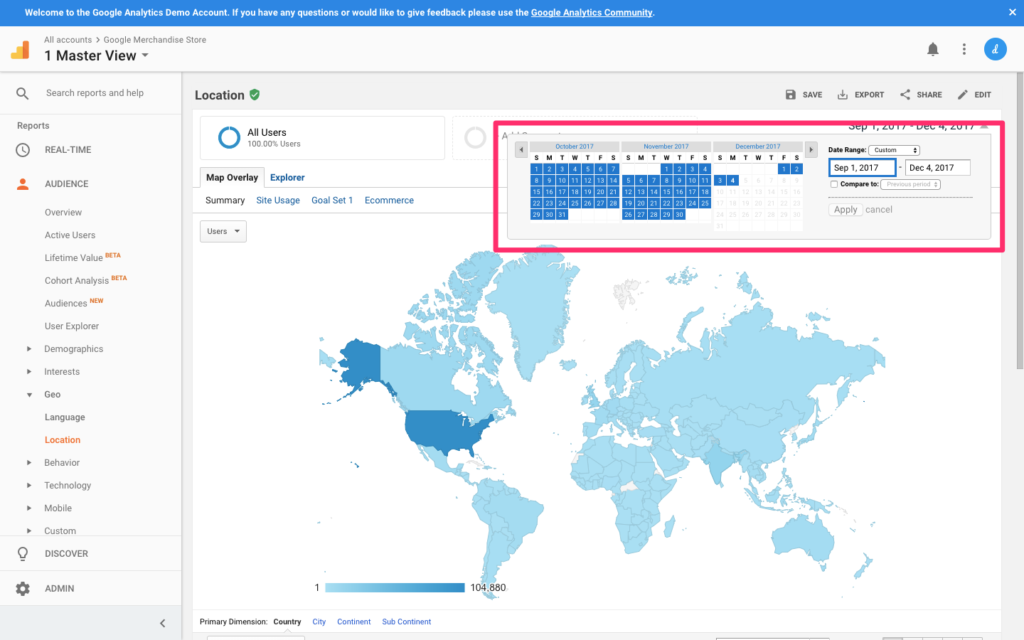
Before reading the data, you’ll want to define an appropriate date range. Consider that 30-day timespan towards the end of the year that incorporates not one, but two Western holidays (Thanksgiving and Christmas). Website traffic is notoriously low over the holidays, and we’ll want to analyze data that we know to be realistic. Analyzing data is always easier when the website in question receives a lot of traffic as well.
From the date range chooser in the top-right corner, choose a range you deem to be appropriate (I would choose a recent 3-month range).
Your first look at user location demographics
Even though the meaning of color varies slightly from region to region, the core symbolism doesn’t change that much. For this reason, analyzing data by Country might seem a little over the top. By Continent might be better.
Scroll down to the table breakdown and select “Continent” as the Primary Dimension. This should make your observations easier to make.
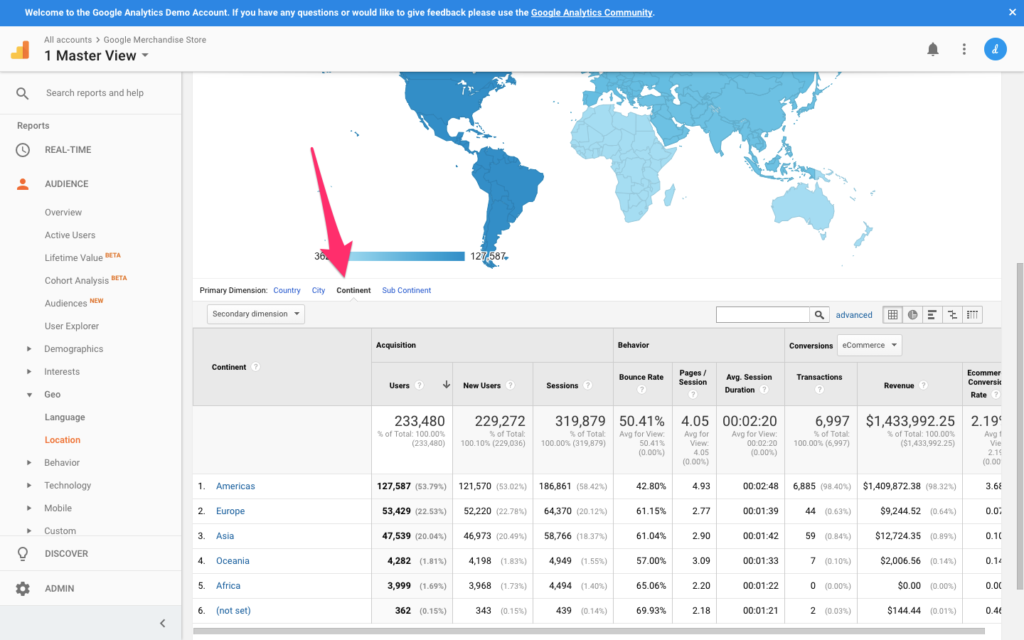
While Americas represents 54% of all users, Europe comes in 2nd with 23%. We’ll start by figuring out if one demographic is clearly having more trouble than the other. Oceania and Africa are the minority at less than 2% each, so they shouldn’t be the primary concern at first. Asia totals at 20%, with metrics similar to those of Europe. Americans are the most common demographic.
Let’s focus on our two largest demographics.
Which Demographic Is Having Trouble?
You can identify which dimensions are having the most trouble by comparing certain metrics (such as Bounce Rate, Pages/Session, Avg. Session Duration, and most importantly, Goal Conversion Rate) with other dimensions, and once you’ve done that, you can then begin to locate the precise moment where those users are exiting your website.
Let’s assume that Europe is your lowest-converting demographic. We’ll need to segment this dimension, filtering for European users.
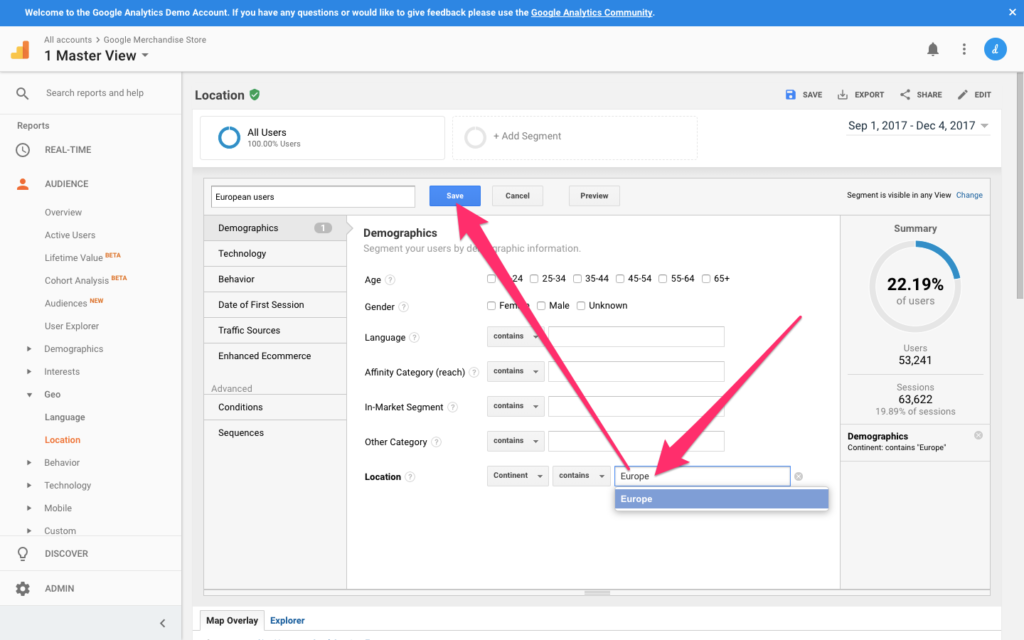
Scroll up and click the “+ Add Segment” button, then “+ New Segment”.
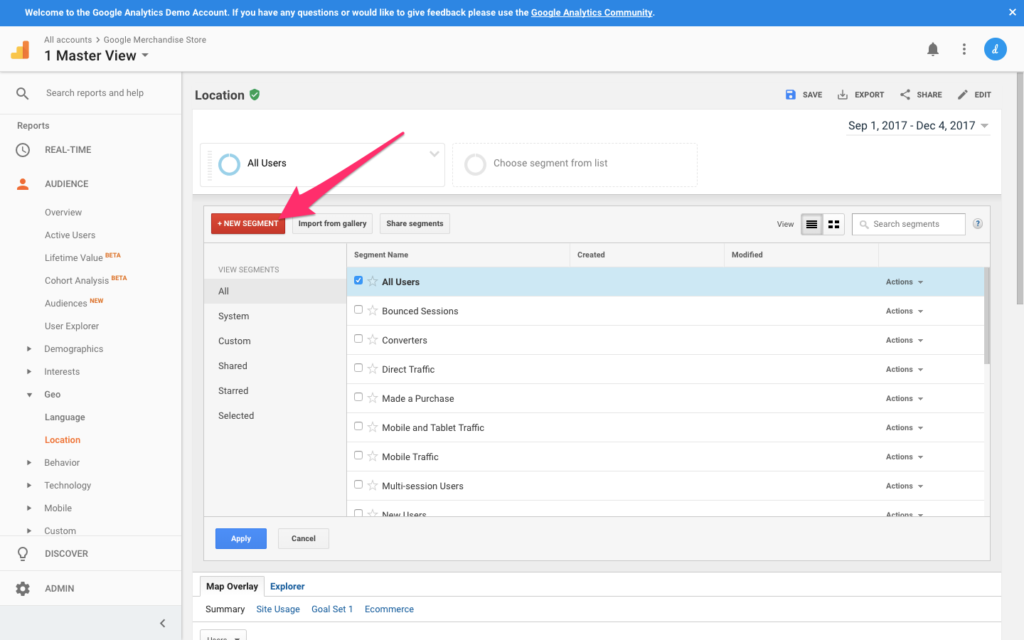
Give your segment a name — for example “European users” — and type “Europe” into the input field described as “Location” (it should autocomplete as “Europe”). Click “Save” to keep the changes.
Where Are They Having Trouble?
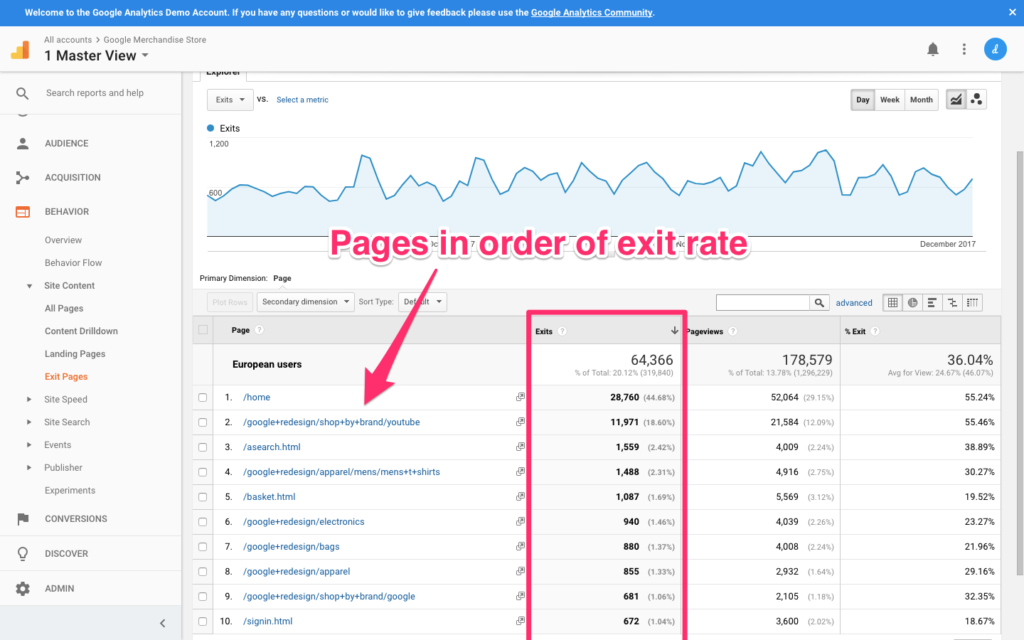
Now that we know who is having trouble, we can find out where. Navigate to Behavior → Site Content → Exit Pages from the reports sidebar, where the report will indicate exactly where users are leaving your website, or more specifically, where our lowest-converting demographic is leaving.
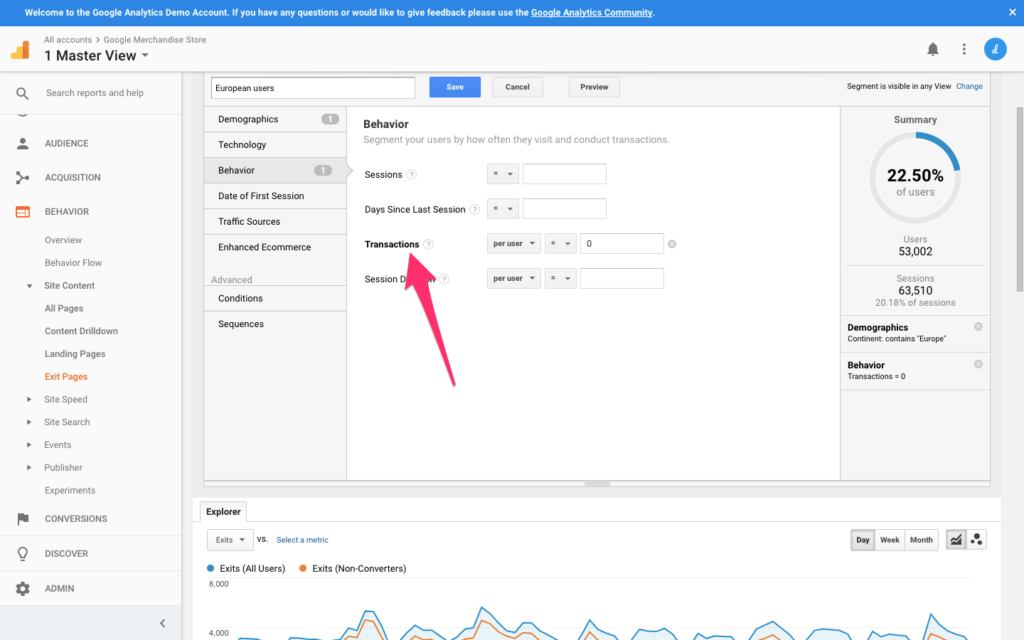
Wait, watch out!
All users leave eventually, right? So we want to make sure that we filter out the users who did convert, because obviously we only want to identify the ones that didn’t, and find out why. You can navigate back to your segment and play around with the segment conditions. In the Behavior tab from the segment customizer dropdown, define the transaction value as “0”, filtering out any users that converted (we don’t have an issue with those users).
Now that we have the who, and the where, we can begin to find out why.
What’s Wrong with the UX?
If one dimension (one continent) is having trouble converting more than any other dimension, you might want to consider the fact that there’s a location-specific issue here. Now, despite what I said about color earlier on, there are actually many issues that could cause a certain demographic to drop out of a conversion. Let’s consider a customer journey involving the user buying something (assuming that you’ve identified a web page that’s critical to the customer checkout journey with a suspiciously high Exit Rate).
Possible issues that may result in a non-conversion:
- you’re not using HTTPS/SSL encryption
- costs aren’t displayed in the buyer’s currency
- it’s not clear what countries you ship to
- colors are making the UI hard to interact with
- payment options are limited (e.g. PayPal doesn’t exist everywhere).
What Next?
From here, you may be able to diagnose specific UX flaws simply from observation, where you can then make the necessary changes and see if metrics improve. If the issue still isn’t clear, you could try usability testing to help locate it. If the issue is clear but the solution isn’t, then try A/B testing.
An analytics-first approach to design can ensure you’re identifying flaws in the UX before haphazardly diving into usability testing, and A/B testing the right things. Time is valuable and limited, so we don’t want to waste it.
You can check out all the articles in our UX Analytics series here.
Frequently Asked Questions (FAQs) about Designing Cultures, Location, and Demographics
What is the importance of understanding demographics in designing cultures?
Understanding demographics is crucial in designing cultures because it provides insights into the characteristics of a population. These characteristics can include age, gender, income, education level, and more. By understanding these factors, designers can create products, services, or systems that are tailored to meet the specific needs and preferences of different demographic groups. This can lead to increased user satisfaction, engagement, and ultimately, success in the market.
How does location influence culture design?
Location plays a significant role in culture design. It influences the social, economic, and political aspects of a community, which in turn shape the culture. For instance, a community located in a coastal area might have a culture centered around fishing or maritime activities. Designers need to consider these location-specific cultural aspects when creating products or services to ensure they resonate with the local population.
What are some methods for collecting demographic data?
There are several methods for collecting demographic data. Surveys and questionnaires are commonly used to gather information directly from individuals. Census data, which is collected by governments, is another valuable source of demographic information. Additionally, market research firms and online analytics tools can provide demographic data based on consumer behavior.
How can demographic data be used to improve user experience?
Demographic data can be used to improve user experience by informing the design process. By understanding the characteristics of the user base, designers can create experiences that are tailored to their needs and preferences. This could involve designing interfaces that are easy to use for older adults, creating content that is relevant to a specific cultural group, or developing features that cater to users with different levels of technological proficiency.
What are the challenges in designing for diverse demographics?
Designing for diverse demographics presents several challenges. One of the main challenges is ensuring inclusivity. It’s important to create designs that are accessible and usable by as many people as possible, regardless of their age, gender, cultural background, or physical abilities. Another challenge is avoiding stereotypes and biases, which can lead to designs that alienate or offend certain demographic groups.
How does culture influence design decisions?
Culture greatly influences design decisions. It shapes people’s perceptions, behaviors, and interactions with products or services. Designers need to understand the cultural context in which their designs will be used to ensure they are appropriate, relevant, and meaningful to the users.
What is the role of demographics in market segmentation?
Demographics play a key role in market segmentation. They allow businesses to divide their target market into distinct groups based on shared characteristics. This enables businesses to tailor their products, services, and marketing strategies to meet the specific needs and preferences of each segment, leading to increased customer satisfaction and business success.
How can designers ensure their designs are culturally sensitive?
Designers can ensure their designs are culturally sensitive by conducting thorough research into the cultural context in which their designs will be used. This includes understanding the values, beliefs, customs, and behaviors of the target demographic. Involving users from the target demographic in the design process, through methods such as user testing and interviews, can also help ensure cultural sensitivity.
What is the relationship between location and demographics?
Location and demographics are closely related. The geographical location of a population can greatly influence its demographic characteristics. For instance, urban areas might have a higher concentration of younger, more educated individuals, while rural areas might have a higher proportion of older adults. Understanding this relationship can help in designing products or services that are tailored to the specific characteristics of a population in a given location.
How can demographic data inform business strategy?
Demographic data can inform business strategy by providing insights into the characteristics, needs, and preferences of the target market. This information can guide decisions about product development, marketing, pricing, and distribution. By aligning their strategies with the demographic realities of their market, businesses can increase their chances of success.
 Daniel Schwarz
Previously, design blog editor at Toptal and SitePoint. Now Daniel advocates for better UX design alongside industry leaders such as Adobe, InVision, Marvel, Wix, Net Magazine, LogRocket, CSS-Tricks, and more.


