Front-end development used to be (kind of) easy. You could install a bunch of browsers on a couple of different computers / operating systems, physical or virtual, and use the developer tools built in almost every browser to solve compatibility problems, or work around different implementations of web standards. This is no longer the case, not since cellular networks became faster, phones became smarter and light “tablet” devices offered yet another way to connect people to the internet from wherever they are. Debugging in these (mostly) mobile devices is a different kind of game, and the fact that more than a dozen different mobile browsers exist is not making the job any easier. This is where remote debugging comes in handy.
Weinre
WEb INspector REmote was built to enable remote inspection and debugging of web pages across different devices. It’s a useful tool, especialy when you need to debug a ”UIWebView” or Safari on iOS while developing on Linux or Windows. weinre reuses the user interface code from the Web Inspector project at WebKit so most front-end developers should already be familiar with the toolbox.
Installation
Installing weinre is documented at the official site. It is a node.js module, so you will have to install that first. On Mac OSX and Linux, after installing Node.js, installation is as simple as running:
sudo npm -g install weinreThe documentation is not quite as clear on how to use weinre on Windows, so I will provide a bit more information on the Windows side of the process. The first thing you should know is your IP address, because visiting the pages on localhost or 127.0.0.1 won’t do. You can find out your IP using ifconfig on Linux or Mac OS and ipconfig on Windows. A static IP address would be ideal for developers using weinre, otherwise you may have to discover your IP every time you boot your computer! How to obtain a specific IP address from your local network is beyond the scope of this article, but here is a guide for Windows, a guide for Mac OSX and one for Ubuntu.
You will then need a HTTP server, since you cannot load HTML files on a mobile device (which is why you have to know the IP address of your computer!). You can use node.js, Apache, IIS, or a static site generator like Middleman or Jekyll — whatever suits your workflow best. There is also a RubyGem that adds a simple helper method to Middleman. I will use Apache, and serve the following -not particularly interesting- static HTML file, with just enough styles to have something to remotely inspect:
<!DOCTYPE html>
<html lang="en">

<head>
  <meta charset="utf-8">
  <title>WEb INspector REmote</title>
  <meta name="viewport" content="width=device-width, initial-scale=1">
  <link rel="stylesheet" href="css/foundation.min.css">

  <style>
    .flex-wrapper {
      display: -webkit-box;
      display: -webkit-flex;
      display: -ms-flexbox;
      display: flex;
      -webkit-flex-wrap: wrap;
          -ms-flex-wrap: wrap;
              flex-wrap: wrap;
    }

    .flex-box {
      -webkit-box-flex: 1;
      -webkit-flex: 1 1 30em;
          -ms-flex: 1 1 30em;
              flex: 1 1 30em;
    }
  </style>
</head>

<body>

<div class="wrapper">
  <div class="row">
    <div class="large-10 large-offset-1 column">
      <h1>Remote Debugging for Front-end Developers</h1>

      <div class="flex-wrapper">
        <div class="flex-box">
          <p>Front-end development used to be (kind of) easy.
          One could easily install a bunch of browsers on a couple
          of different computers / operating systems, physical
          or virtual, and use the developer tools built in almost
          every browser to solve compatibility problems, or work
          around different implementations of web standards.
          This is no longer the case, not since cellular networks
          became faster, phones became smarter and light “tablet”
          devices offered a new way to connect people to the internet
          from wherever they are. Debugging in these (mostly)
          mobile devices is a different kind of game, and the fact
          that more than a dozen different mobile browsers
          exist is not making the job any easier.</p>
        </div>
        <div class="flex-box">
          <blockquote cite="http://people.apache.org/~pmuellr/weinre/docs/latest/Home.html">
            <p>weinre is WEb INspector REmote. Pronounced like
            the word “winery”. Or maybe like the word “weiner”. Who
            knows, really.</p>
          </blockquote>
          <p>WEb INspector REmote was built to enable remote inspection
          and debugging of web pages across different devices. It’s a
          useful tool, especially when you need to debug a ”UIWebView”
          or Safari on iOS while developing on Linux or Windows. weinre
          *reuses the user interface code from the Web Inspector project
          at WebKit* so most front-end developers should already be
          familiar with the toolbox.</p>
        </div>
      </div>
    </div>
  </div>
</div>

</body>
</html>
Running Weinre
If you don’t want to configure weinre every time you run it, you should make a server.properties file in a .weinre directory. Open a command prompt in your profile directory (Windows users: you must use the console to make a folder with that name! Press Win + R and type “cmd” or press the “Windows” key, type a few characters from “command prompt”, then press enter) and type mkdir .weinre to make a new directory. The resulting path for Windows users, should be something like C:\Users\YOU_USER_NAME\.weinre.
Once this folder is ready, create a new text file inside named server.properties, with the following contents:
boundHost:    -all-
httpPort:     8081
reuseAddr:    true
readTimeout:  1
deathTimeout: 5
Feel free to change the httpPort, if that one is occupied. You should now be able run weinre by typing weinre on the command prompt, and the weinre server will listen to the selected port. Add the following line in the page you need to debug (or the above test HTML file we provided above):
<script src="http://YOUR_IP_ADDRESS:8081/target/target-script-min.js"></script>Start your favorite webkit-based browser and type the address of the weinre server: http://YOUR_IP_ADDRESS:8081/client/. This is your debugger! Now open the web page that you just added the script into on your smartphone/tablet, a different browser, computer, or even a virtual OS/device — it doesn’t make any difference. You should be able to see this client on the weinre debugger and use those dev tools to inspect the page on the device! You can view (most) applied CSS on any DOM element, add, remove or change inline styles and see any JavaScript messages in the console. You can also run JavaScript commands in the console and manipulate the DOM. That should be more than enough to help pinpoint any rendering errors or unexpected behaviour!
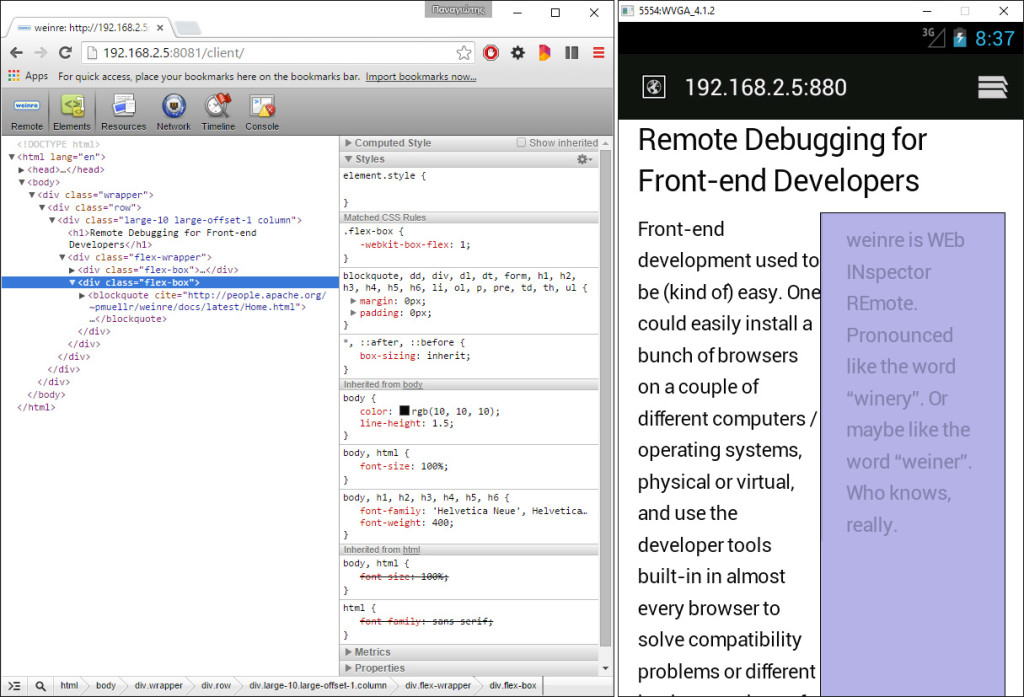
Weinre in Action
Here is an example of inspecting the default browser in Android 4.1.2:
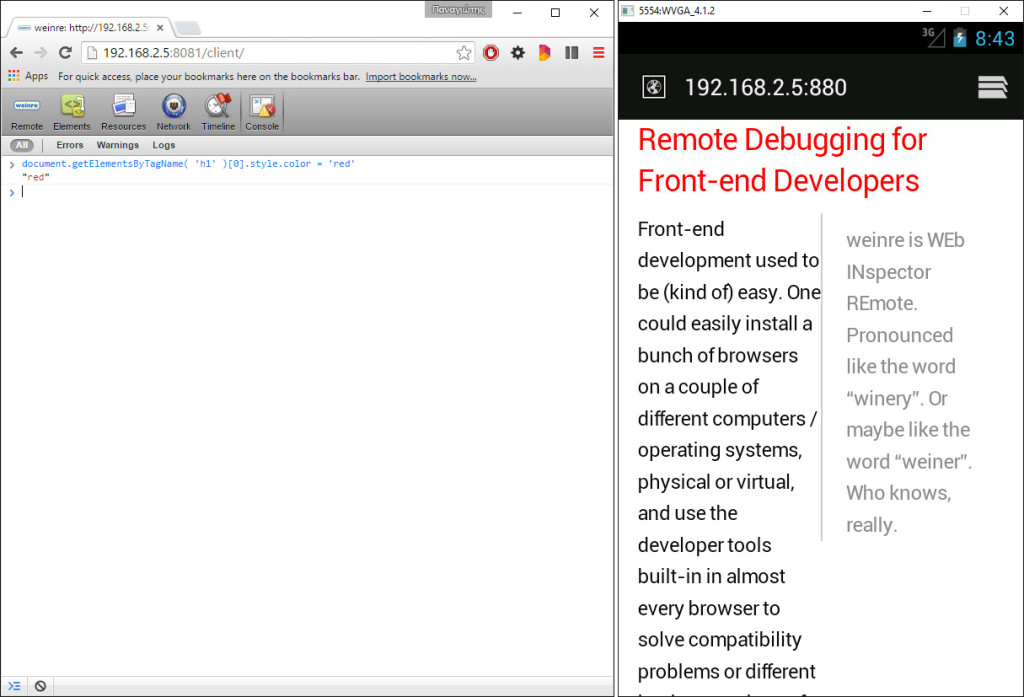
We can change the text color using the JavaScript console:
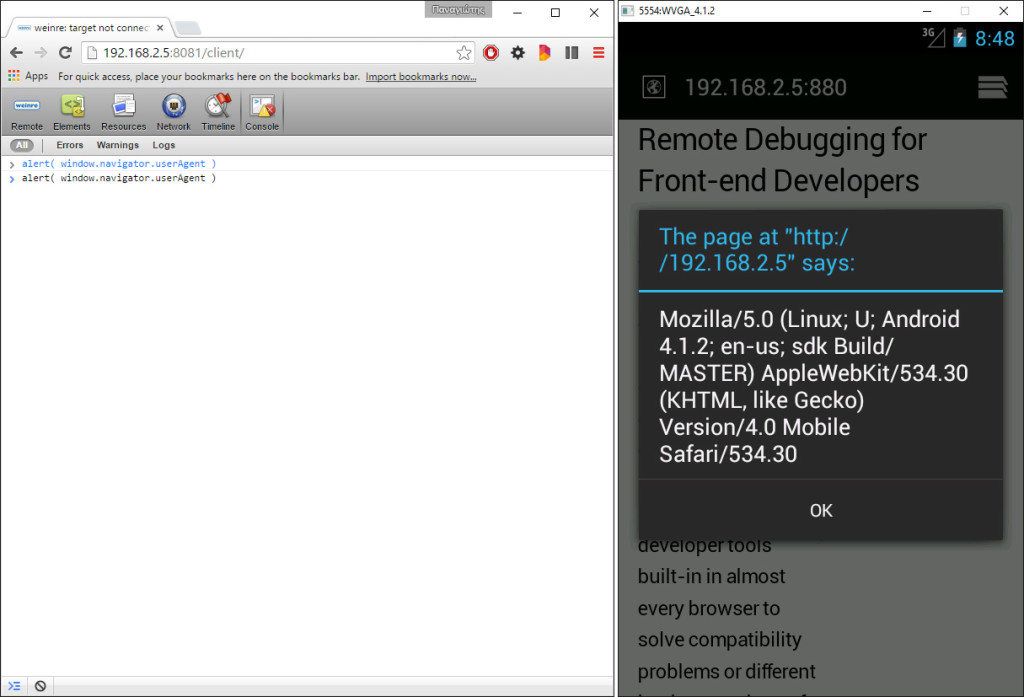
Along with any other JavaScript commands:
Applications Using Weinre
- Prepros is a tool to compile Less, Sass, Compass, Stylus, Jade and more with automatic CSS prefixing, a built-in server for cross browser testing and remote debugging capabilities. It even works cross platform!
Valence
Valence is an add-on for Firefox that enables the Firefox Developer Tools to remotely inspect / debug Gecko-based browsers, Chrome, and Safari on iOS. The debug “target” can be an iOS device or a Chrome desktop browser (using the --remote-debugging-port=9222 special “flag” to allow remote inspection — see the Chrome Desktop setup paragraph on the Valence site for instructions) or Firefox OS. Valence, unfortunately, cannot inspect Android device emulators, or older Android devices, but UIWebViews and Simulators on iOS can be inspected — although I haven’t tried it, since I don’t own an Apple computer.
The smartphone / tablet must be physically connected to your computer and if you are using Windows, you will probably need to install USB drivers for your device, which may or may not even exist! Windows users will also have to install iTunes if they need to inspect iOS. Lastly, developer mode and/or USB debugging must be enabled — please remember to deactivate the settings when your work is done! Valence is rather limited at the moment, and somewhat unstable as an early beta can be, but it is a promising tool.
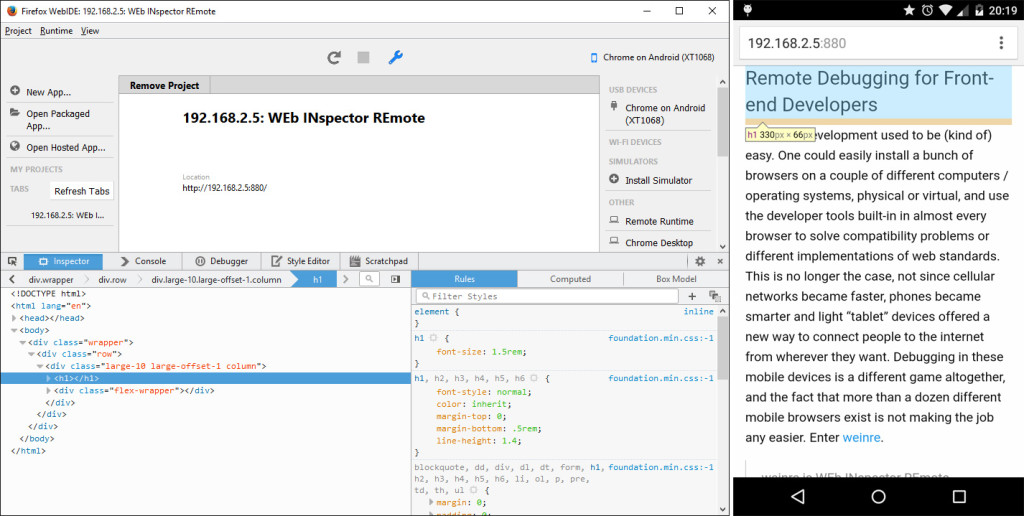
Valence in Action
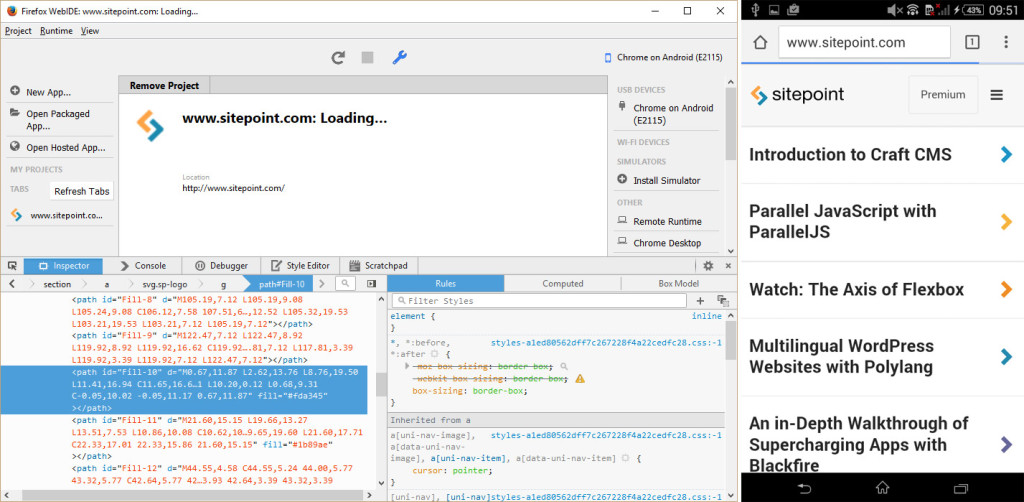
Inspecting the HTML source and styles of a Chrome browser on an Android 5 smartphone:
Any site can be inspected:
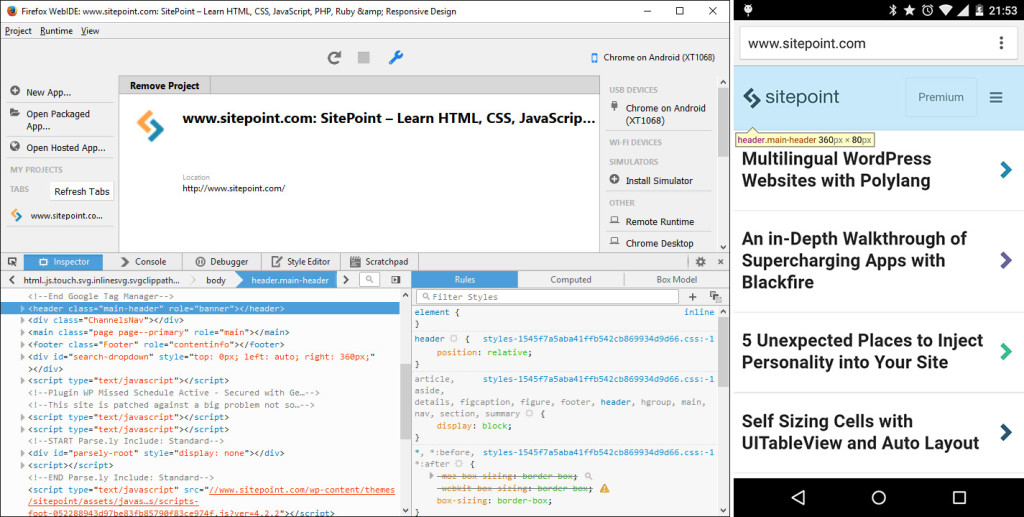
Adding color attributes to SVG paths, to change the logo:
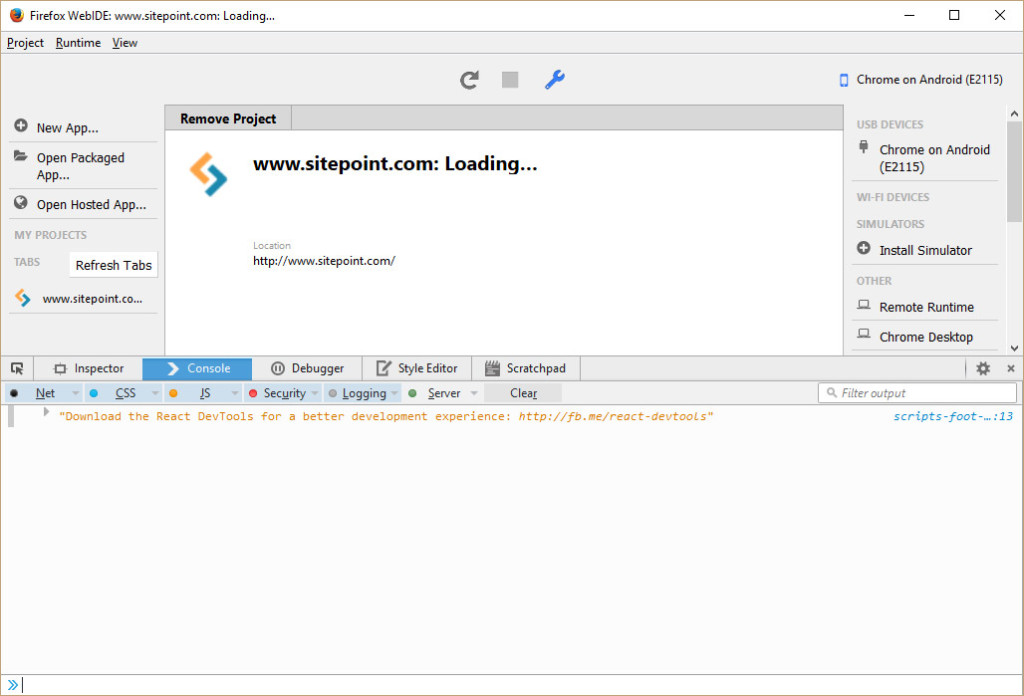
Ok React… thank you for leaving the console message for me below!
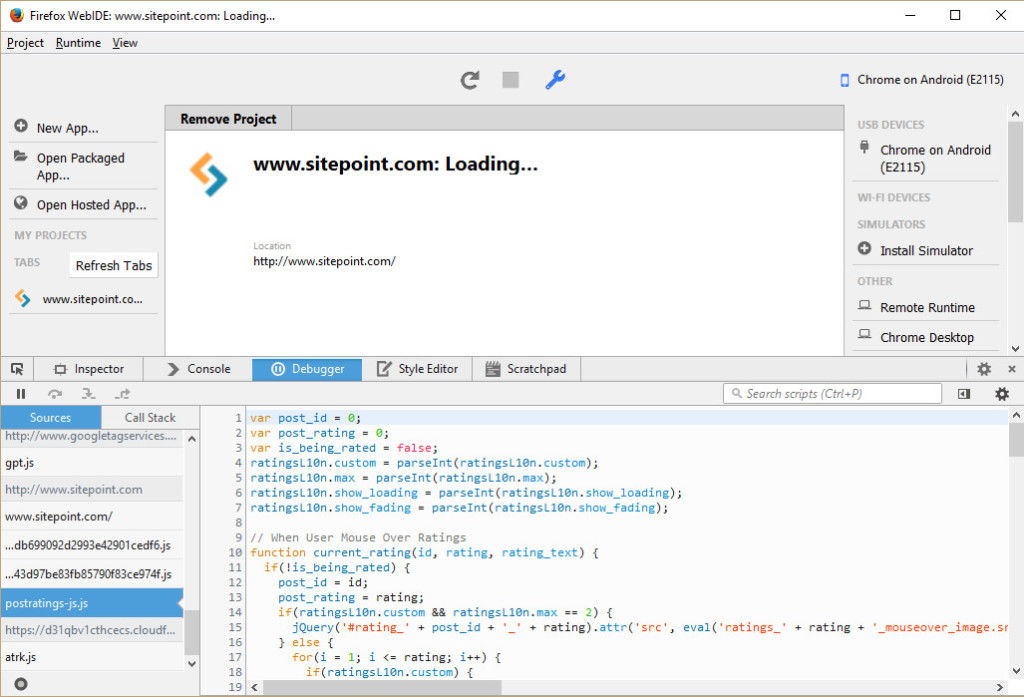
Here is an example of debugging JavaScript:
Conclusion
Debugging any CSS rendering inconsistencies or different JavaScript behavior on desktop browsers is relatively easy — and rarely needed these days, since most modern browsers are updated regularly and support a large set of web standards. But mobile browsers are not that easy to develop for. There are literally dozens of them, and while the Can I Use database provides valuable information on CSS and JavaScript API support in different platforms, knowing about support of a given feature on a given browser is sometimes different than seeing it, or not seeing it at all! Weinre and Valence can greatly help front-end developers, providing tools to remotely inspect / debug mobile devices.
Frequently Asked Questions on Remote Debugging for Front-End Developers
What is remote debugging and why is it important for front-end developers?
Remote debugging is a method used by developers to troubleshoot code and identify issues in a web application. It involves connecting a debugging tool to a remote system, allowing developers to control and monitor the execution of their code on that system. This is particularly important for front-end developers as it allows them to test and debug their code in the actual environment where it will be running. This can help to identify and resolve issues that may not be apparent when testing on a local system.
How can I set up remote debugging for my web application?
Setting up remote debugging for your web application involves several steps. First, you need to install a debugging tool that supports remote debugging. Some popular options include Chrome DevTools, Safari Web Inspector, and Firefox Developer Tools. Once you have a debugging tool installed, you need to configure it to connect to your remote system. This typically involves entering the IP address or hostname of the remote system and specifying a port number for the debugging tool to connect to. Once the connection is established, you can start debugging your code.
What are some common issues that can be identified and resolved using remote debugging?
Remote debugging can help to identify a wide range of issues in your web application. These can include JavaScript errors, CSS styling issues, HTML markup errors, and performance issues. By stepping through your code and monitoring its execution on the remote system, you can pinpoint the exact location and cause of these issues, making it easier to resolve them.
Can I use remote debugging to test my web application on different devices and browsers?
Yes, remote debugging can be used to test your web application on different devices and browsers. This is particularly useful for ensuring that your web application works correctly on all the platforms and browsers that your users might be using. By connecting your debugging tool to a remote device or browser, you can test and debug your code in the same environment that your users will be using.
How can I use Chrome DevTools for remote debugging?
Chrome DevTools is a powerful tool for remote debugging. To use it, you first need to enable remote debugging on the device you want to debug. This can be done by navigating to the ‘Developer options’ in the device’s settings and enabling ‘USB debugging’. Once this is done, connect the device to your computer using a USB cable. You can then open Chrome DevTools on your computer and select the ‘Remote devices’ tab. From here, you can select the device you want to debug and start a new debugging session.
What are the benefits of using remote debugging over traditional debugging methods?
Remote debugging offers several benefits over traditional debugging methods. It allows developers to test and debug their code in the actual environment where it will be running, which can help to identify issues that may not be apparent when testing on a local system. It also allows developers to test their code on different devices and browsers, ensuring that their web application works correctly for all users.
Can I use remote debugging to debug JavaScript code?
Yes, remote debugging can be used to debug JavaScript code. Most modern debugging tools, including Chrome DevTools, Safari Web Inspector, and Firefox Developer Tools, support JavaScript debugging. This allows you to step through your JavaScript code, set breakpoints, and monitor variables and expressions, all from your local system.
How can I use remote debugging to improve the performance of my web application?
Remote debugging can be used to identify performance issues in your web application. By monitoring the execution of your code on the remote system, you can identify bottlenecks and areas of your code that are causing performance issues. Once these issues are identified, you can make the necessary changes to your code to improve its performance.
Are there any security concerns with using remote debugging?
While remote debugging is a powerful tool, it does come with some security concerns. When you connect a debugging tool to a remote system, you are essentially giving that tool control over the execution of your code on that system. This could potentially be exploited by malicious actors if the connection between the debugging tool and the remote system is not secure. Therefore, it’s important to always use secure connections when using remote debugging and to only connect to trusted remote systems.
Can I use remote debugging with mobile devices?
Yes, remote debugging can be used with mobile devices. Most modern debugging tools, including Chrome DevTools, Safari Web Inspector, and Firefox Developer Tools, support remote debugging on mobile devices. This allows you to test and debug your web application on the actual devices that your users will be using, ensuring that it works correctly on all platforms.
 Panayiotis Velisarakos
Panayiotis is a front-end developer from Greece. He has been making web things since 1997, when he built his first site for IE 4 using tables and JavaScript 1.2 in a weekend, which got him a job at an agency. He tried his hand at various back-end technologies, and failed — he likes the browser better! He sometimes blogs at pvgr.eu.


