Key Takeaways
- FirePHP is a PHP library that generates console messages in the browser from your PHP code. The messages are sent as HTTP headers with the server response and are safer for debugging than methods that display information to non-programmers through the webpage.
- Setting up FirePHP involves downloading the library directly or via PEAR, and installing browser extensions, such as FireBug for Firefox or FirePHP4Chrome for Chrome, which act as proxies for JavaScript console methods and convert headers into console log messages.
- FirePHP supports four types of messages: log, info, warn, and error. The library can be called in multiple ways, including pure global function procedural calls, static method calls, and fully instantiated object calls. It provides advanced features like message grouping, tables, and traces.
- While FirePHP is a useful tool for quicker debugging and application level logging, it’s important to remember not to leave FirePHP calls enabled with critical system information available in production. The safest method of debugging is still to use a debugger environment set up within your IDE.
As the technical manager of a suite of software projects, one of my duties is doing code reviews. One of the things I see far more often than I’d like when doing reviews is debugging PHP code committed and pushed up the chain. Raise your hand if you’ve done this:
<?php
$total = $someService->getComplexTotal();
var_dump($total);
$someOtherService->processTotal($total);
Ok, so you don’t have to raise your hand. But chances are, you smiled a bit. Either “Yeah, how did he know I do that?” or “Yeah, I used to do that. But I have other ways of debugging now.” What an awesome segue!
We should use a debugging method that does not display information to a non-programmers through the web page. That is to say, we should never see variable dumps or SQL statements echo’d to the screen. This can’t happen.
The safest method of debugging requires configuring your IDE to use a tool like Xdebug or Zend Debugger to trace currently executing code. This isn’t always practical. In the absence of using a fully configured debug environment, I turn to FirePHP.
Use FirePHP for Safer PHP Debugging
FirePHP is a PHP library used to generate console messages in the browser from your PHP code. Console messages are generally created by JavaScript, but FirePHP sends similar messages as HTTP headers with the response from the server. Various browser extensions act as proxies for the JavaScript console methods and convert these headers into console log messages.
Why is this “safer” that outputting debug data? Well, when using methods like JavaScript’s console.log(), you need to make a concerted effort to view the debug messages. Normal visitors would not have the development console open on their browser, and therefore will not see your debug messages. If you’re outputting var_dump()‘s instead, there is no way NOT to see the messages.
Do note, I call this “safer,” but you still must take care not to leave FirePHP calls enabled with critical system information available in production.
Setting Up FirePHP
Visit the FirePHP Core Install page to choose to download the library directly or get the commands to install via PEAR. If you use other frameworks, such as Zend Framework, log writers already exist for FirePHP so an additional download is not necessary.
If you’re using Firefox, install FireBug for an expanded set of tools to debug your web applications, and then install the FirePHP extension to extend FireBug and intercept the FirePHP messages.
If you are using Chrome, simply install one extension FirePHP4Chrome. (Full disclosure: I created this Chrome extension and actively develop it. I hadn’t had a lot of luck with other plugins in Chrome.)
Finally, open the console in your browser of choice. In Firefox, click the Firebug icon to display the console. Verify FirePHP is enabled by clicking the FirePHP icon in the console view and noting whether the check mark is next to enabled. In Chrome, click the settings icon, choose tools, and click ‘Developer Tools’ to display the console. FirePHP4Chrome will be automatically enabled when the console is opened.
Basic Logging With FirePHP
If you’ve ever worked with different error level logging, you’ve undoubtedly seen the debate on the differences between what types of errors should be “warn” versus “error.” Or, whether you should you use “info” versus “log.” While I have my own opinions, I won’t bore you with them. Suffice to say there may be reasons to differentiate a message you want to send to the console in a different way than a standard message.
The four types of messages that the FirePHP protocol supports currently are: log, info, warn, and error. I aim to show you how you can use each one. It is up to you to choose the proper one for your environment and the context of your debugging/logging.
The following code demonstrates how to include the FirePHP library and execute each of the logging types.
<?php
require 'FirePHPCore/fb.php';
FB::log('Log message');
FB::info('Info message');
FB::warn('Warn message');
FB::error('Error message');
The above code simply includes the core FirePHP library and calls the various logging methods. There are multiple ways to call the library methods; it supports pure global function procedural calls, static method calls, and fully instantiated object calls. I use the static methods because I generally want to use FirePHP in only one line to send debug information; I want to do it quickly!
Below, you’ll see screenshots with the output on both Firefox and Chrome.
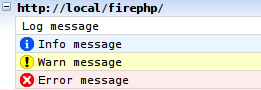
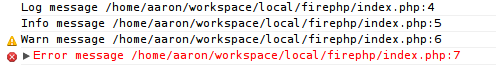
Firefox’s display is a bit prettier. The Chrome version does not have an icon for “info” because console.log() in Chrome does not support the icon yet. You’ll also notice later that the table output in Chrome is very rudimentary. This is because Chrome does not support console.table() in the non-experimental feature-set yet. While I use Chrome for my own development, I’ll use Firefox in my screenshots in the rest of this article.
To make the logging information more useful, it is possible to add a label to the log messages. This is specified as the second parameter of the logging methods.
<?php
require 'FirePHPCore/fb.php';
$turtles = $zooService->fetchAllTurtles();
FB::info($turtles, "All Turtles");
As you see in the following screenshot, the zoo service in my example fetched three turtles. It was clear that this particular log message was turtles, and say, not famous actors or something else. To save space, Firebug/FirePHP has collapsed the output. Hover over the line to see the entire output.
![]()
Advanced Logging With FirePHP
FirePHP is great for generating one-time log messages as I’ve already demonstrated. However, there are more advanced features which make FirePHP really shine. Three that I’ll cover quickly are message grouping, tables, and traces.
Grouping
Let’s pretend we have a bit of logging that we need to do in a loop. It could potentially get out of hand and make the console scroll. We may want to put that it a group so that it can easily be collapsed and expanded. In this sample code, I’ll log four entries of information I want grouped together.
<?php
require 'FirePHPCore/fb.php';
$specialHashes = array();
for ($x = 0; $x < 5; $x++) {
    $specialHashes[$x] = sha1($x . 'somesalt');
    FB::info($specialHashes[$x], "Hash #" . $x);
}
And the output:
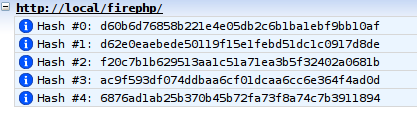
The log message is slightly longer than I might like. I want to group it intelligently and allow for it to be collapsed. I have modified the code to include grouping methods built into FirePHP.
<?php
require 'FirePHPCore/fb.php';
$specialHashes = array();
FB::group('Special Hashes');
for ($x = 0; $x < 5; $x++) {
    $specialHashes[$x] = sha1($x . 'somesalt');
    FB::info($specialHashes[$x], "Hash #" . $x);
}
FB::groupEnd();
And now, the new output:
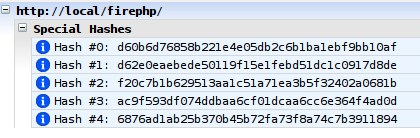
As you can see, there is now an option to minimize the group labeled “Special Hashes.” FirePHP even allows for a group to be collapsed by default. Simply replace the group() call and add an options array as follows:
FB::group('Special Hashes', array('Collapsed'=>true));Tables
FirePHP can send tabular data pretty easily. In fact, since Firefox’s console.table() method is so great, the data displays beautifully and is easy to understand. (Oh Chrome, please catch up!) To send table data in FirePHP, an array of columns is used. However, the first element of the array must be the column names. Using our special hashes example, let’s log them as a table:
<?php
require 'FirePHPCore/fb.php';
$specialHashes = array();
for ($x = 0; $x < 5; $x++) {
    $specialHashes[] = array($x, sha1($x . 'somesalt'));
}
$headers = array('Hash #', 'Hash Value');
$logTable = array($headers) + $specialHashes;
FB::table("Special Hashes", $logTable);
You may notice one thing that I did a bit differently is the creation of the $logTable variable. Since the first element of the array sent to the table() method needs to be column labels, I created a temporary variable to do this task for me. I don’t want to manipulate the $specialHashes array – that is my business data. The table() method takes a Label parameter followed by the array of columns.
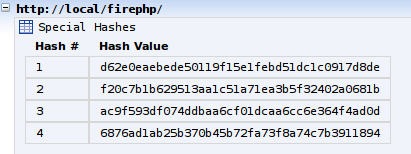
When the console loads the data from FirePHP, the table is collapsed. For the above screenshot, I clicked the label to display the data.
Traces
Traces can be invaluable when debugging PHP code. Whether you want to couple them with a log message showing a variable’s value at specific point in the code or you need more information from an exception, trace is where it’s at. Very simply, you can call a trace anywhere in your PHP code with FirePHP as shown here:
<?php
require 'FirePHPCore/fb.php';
FB::trace('Simple Trace');
And the output:

When the output was displayed, I simply clicked on the label of “Simple Trace” to display the entire trace. This example is very simple and shows how easily it can be inserted into any code.
Let’s make a bit more complex of an example (although, I doubt you’ll actually want to make code like this in your project):
<?php
require 'FirePHPCore/fb.php';
function one() {
    echo "This is one.<br>";
    two();
}
function two() {
    echo "This is two!<br>";
    FB::trace('Trace from function two.');
}
one();
Here, function one() is being called. Function two() is invoked in the last line of the function. After two() finishes, it executes a trace call to FirePHP. The following screenshot shows Firefox’s output:

… And There’s More!
There is much more you can do with FirePHP than just the above examples. To view more information about specifying other options, setting up exception traces, and even using assertions, check out the FirePHP Headquarters.
A Bonus Example
As with most introduction style articles, the information here has been relatively generic and the examples mild. Need a bit more in-depth example to persuade you to use FirePHP? Let’s go:
<?php
try {
$key = "user.{$userId}";
if (!SimpleCache::has($key)) {
FB::info($key, 'Cache miss:');
$userService = new UserService();
$user = $userService->fetchById($userId);
SimpleCache::set($key, $user);
}
$user = SimpleCache::get($key);
}
catch (Exception $e) {
FB::error($e);
Router::generate500();
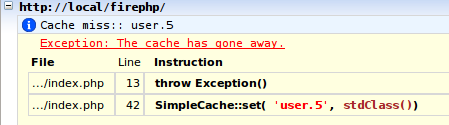
}This simple example code is built to retrieve a user object. This system uses some type of caching and throws exceptions when a user is not available. The first time this code runs, the user is not cached so FirePHP sends an info message. For user ID of 5, the following screenshot shows the output.
![]()
The second time the code is ran, the method info() is not called and no message is sent to the console. Now, let’s imagine that the cache has become unavailable. (I could have created the code so that it could run if the cache wasn’t present, but that would just take away all of the fun!) In the case where the cache is no longer available, the set() method will throw an exception. The screen will show a nice error 500 message, according to this code. But, I’d like to see the exception and stack trace right away. That’s where the error() method comes in. It can interpret the Exception object and log it nicely for me.
Summary
The safest way to debug your PHP code is to use a debugger environment set up within your IDE. However, for quicker debugging as well as application level logging, FirePHP can play an important role.
Image via Fotolia
Frequently Asked Questions (FAQs) about Debugging PHP Code with FirePHP
How do I install FirePHP on my browser?
FirePHP can be installed as an extension on your browser. For Google Chrome, you can visit the Chrome Web Store and search for ‘FirePHP Official’. Click on ‘Add to Chrome’ to install. For Mozilla Firefox, you can visit the Firefox Add-ons page and search for ‘FirePHP’. Click on ‘Add to Firefox’ to install. After installation, you will see the FirePHP icon on your browser toolbar.
How do I use FirePHP to debug PHP code?
After installing FirePHP, you can use it to debug PHP code by sending debug data from your server-side PHP script to your browser. You can do this by including FirePHP as a library in your PHP script and using FirePHP’s functions to log debug data. The data will be displayed in your browser’s console, allowing you to inspect it without affecting the output of your script.
What kind of data can I debug with FirePHP?
FirePHP allows you to debug a wide range of data types, including strings, arrays, objects, and exceptions. You can also use it to log custom data, such as SQL queries or function calls, which can be very useful for tracking down bugs or performance issues.
How do I set up FirePHP with Firefox Developer?
To set up FirePHP with Firefox Developer, you first need to install the FirePHP extension from the Firefox Add-ons page. Once installed, you can enable FirePHP in the ‘Network’ tab of the Firefox Developer Tools. You will then be able to see FirePHP logs in the ‘Console’ tab.
Can I use FirePHP with other programming languages?
FirePHP is primarily designed for use with PHP, but it can also be used with other server-side languages that support HTTP headers. This includes languages like Python, Ruby, and Java. However, you may need to find or write a library to interface with FirePHP, as it does not natively support these languages.
How do I handle errors and exceptions with FirePHP?
FirePHP provides functions for logging errors and exceptions, which can be very useful for debugging. You can use the fb() function to log an error or exception, and it will be displayed in your browser’s console along with a stack trace. This can help you to quickly identify the source of the problem.
Can I use FirePHP in a production environment?
While FirePHP can be used in a production environment, it is generally not recommended. This is because FirePHP sends debug data via HTTP headers, which can potentially expose sensitive information. It is best to use FirePHP in a development or testing environment, and to disable it in production.
How do I disable FirePHP?
You can disable FirePHP by removing or commenting out the code that includes the FirePHP library and initializes the FirePHP object. You can also disable FirePHP in your browser by disabling the FirePHP extension.
Can I customize the output of FirePHP?
Yes, FirePHP provides several options for customizing the output. You can change the format of the output, include or exclude certain types of data, and even create your own custom loggers. This can be very useful for tailoring FirePHP to your specific debugging needs.
What are some alternatives to FirePHP?
There are several alternatives to FirePHP for debugging PHP code, including Xdebug, PHP Debug Bar, and Kint. These tools offer similar functionality to FirePHP, but with different features and interfaces. It’s worth trying out a few different tools to see which one works best for you.
Aaron Saray is a PHP Web Developer based in Milwaukee, Wisconsin, USA. The author and technical editor of multiple PHP and Web Technology books, organizer of the Milwaukee PHP Users Group, and overall good guy, Aaron continually shares his knowledge, tips and tricks, and leadership skills through his blog.


Published in
·Computer science·Development Environment·PHP·Programming·Software Development·May 9, 2014