All the major browsers now provide tools to help test and debug websites on mobile devices. In this article I will look specifically at Firefox’s offerings and then compare them to Chrome and Internet Explorer.
Testing with Firefox Responsive Mode
Responsive web design is a good way to make a website mobile-friendly, allowing us to adapt layouts according to screen size.
The simplest way to test a responsive design has typically been to resize the browser’s window. However, it’s not always practical or precise. This is where Firefox’s Responsive Mode tries to help.
Available since Firefox 15, the responsive mode, also called responsive design view, is a mode especially built to test the mobile version of a website.
You can activate responsive mode from the Responsive Design View entry in the Web Developer submenu of Firefox’s main menu (Or the Tools menu on some OSs). You can also use the button on the Developer toolbar or the keyboard shortcut Ctrl + Shift + M (or Cmd + Opt + M on Mac OS). Deactivate the mode by using the same menu, button or keyboard shortcuts, or by closing the responsive interface.
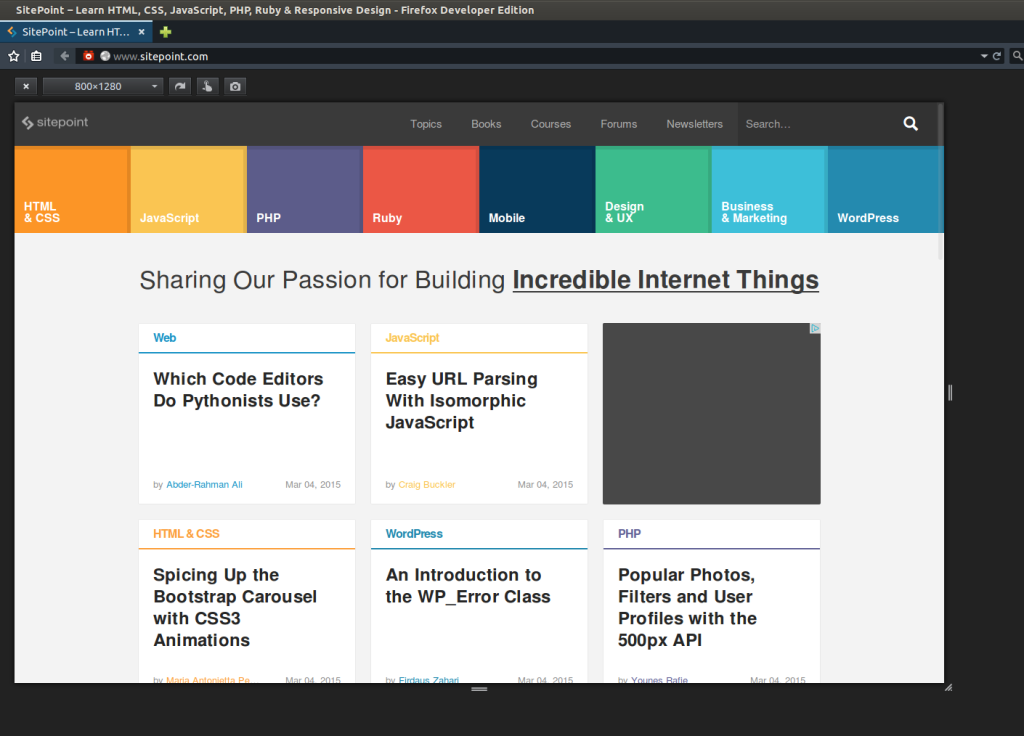
Resizing the View
By activating Responsive Design View, Firefox will resize the view but not the window. As with resizing the window, you can resize the view with your mouse using the controls on the right and bottom sides and the bottom-right corner of the view.
These controls are useful to see how and when your design adapts to its layout. You can also use the preset list at the top of the view.
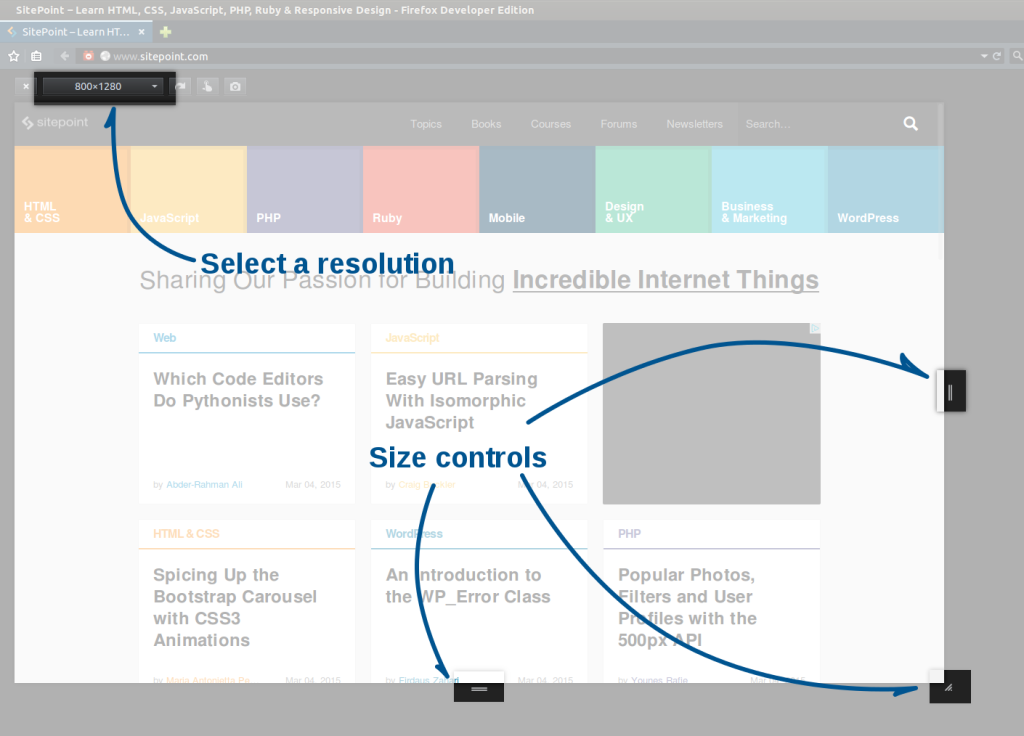
This list contains several classic resolutions, such as 320×480 pixels or 768×1024 pixels. If you can’t find what you are looking for, you can define your own resolution by editing the current selected size (type in the dropdown). This will save the new resolution to the presets dropdown.
Finally, you can simulate an orientation change by hitting the rotation button at the right of the list.
Touch Events
The far-right button in the Responsive Design View allows you to take a screenshot of the current view and next to this is the ‘Simulate touch events’ button.
Using this button, you can translate mouse events into touch events. This way, if you click on the view with your mouse, Firefox won’t send a mouse click event but a touch event. This translation can be useful if your website or application needs touch events.
Debug Your Code with Remote Debugging
The Responsive Design View is useful but it can’t replace a real smartphone (or tablet). If your mobile device runs Android, then Firefox can provide another great tool, remote debugging.
Remote debugging allows you to access the developers’ toolbox, but for mobile websites.
To use remote debugging, you will need to install Firefox for Android. You will need a USB cable to connect your mobile device to your computer. Note that, like the responsive mode, remote debugging appeared in Firefox 15.
Preparing the Computer
Firefox uses ADB to create the connection between the computer and the mobile device so, first, we need to install ADB. Depending on the system you are using, there are several ways to install ADB, for example Ubuntu provides the adb package to install like other packages.
The best way to install ADB is by downloading the Android SDK. You can find the SDK on the Android Developers website, available for Windows, OS X and Linux. You won’t need Android Studio, so you can just download the SDK tools.
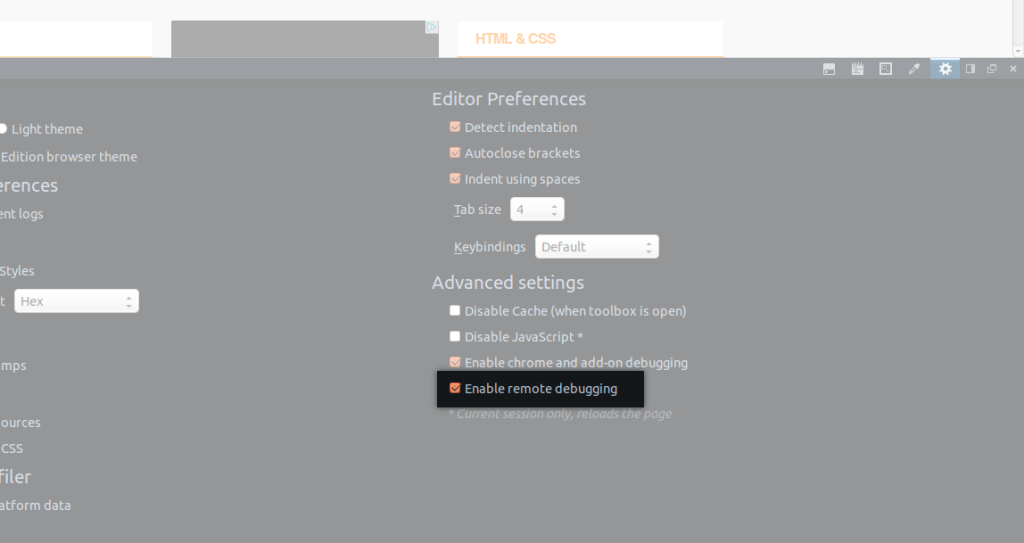
Next, we need to enable remote debugging on Firefox.
Open the toolbox and the “Settings” panel. In this panel, you will find a checkbox labeled “Enable remote debugging”. Activate this checkbox and restart Firefox if needed.
Preparing the Mobile Device
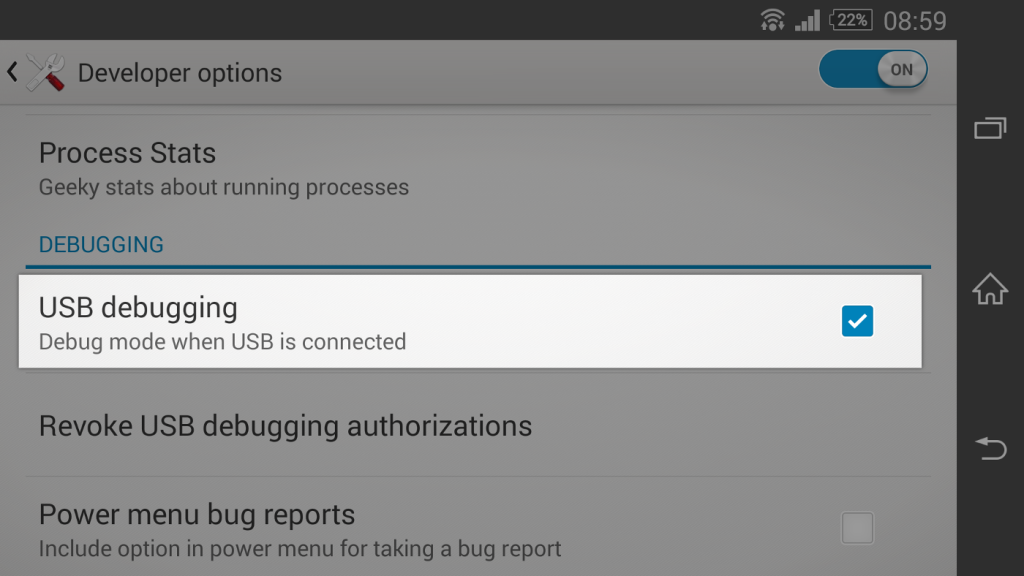
On the Android device, we need to enable USB debugging. Without that, the computer and the mobile device won’t be able to communicate.
To enable USB debugging, open the settings of your mobile device. You will find the corresponding checkbox in the “Developer options” section of these settings. If you don’t have access to these settings you can gain access by tapping several times on “Build number” entry of the “About phone” section in the settings of your mobile device.
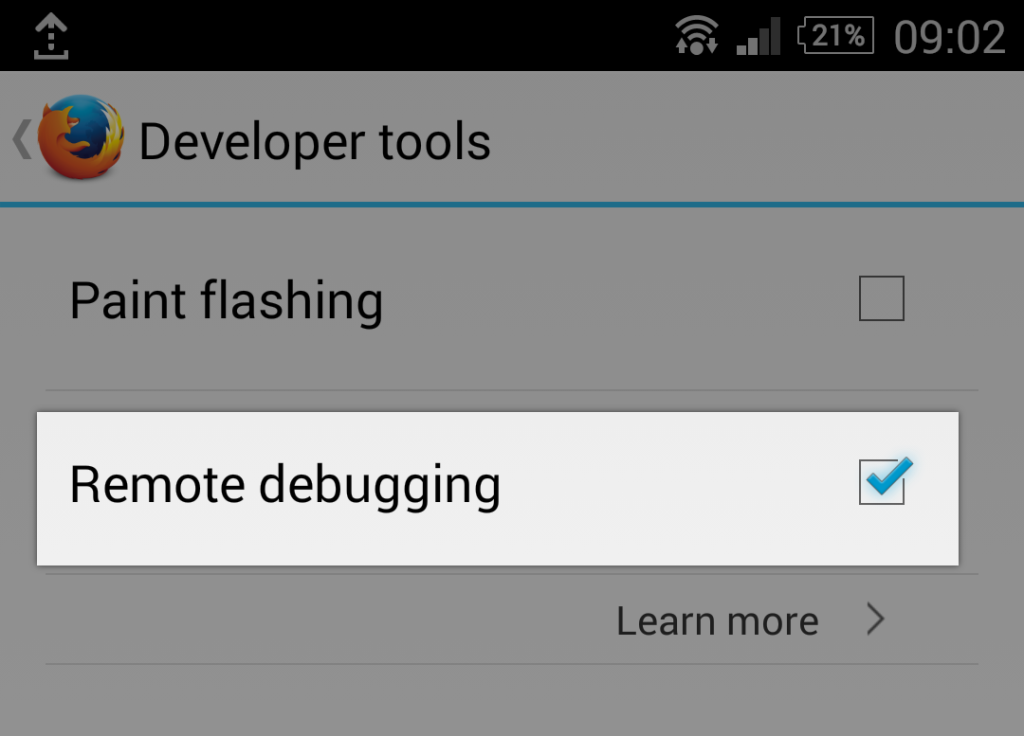
As with your computer, you need to activate remote debugging in Firefox for Android. If you use Firefox 25 or later, check the “Remote debugging” box in the “Developer tools” section of the “Settings” menu.
If you use Firefox 24 or earlier and don’t want to update, type “about:config” in the URL bar. On this special page, search for the devtools.debugger.remote-enabled preference and set it to true by hitting the “Toggle” button if necessary.
Creating the Connection
Now we are ready to create our connection between the computer and the mobile device. Note that you won’t have to follow all the steps above each time you want to use remote debugging. Unless you disable it, the only steps you will have to follow each time you want to create a connection are the ones below.
Starting the Server
Begin by attaching your mobile device with a USB cable. Open a command prompt and start the ADB server if it is not already running with the following command.
adb start-server
You will ensure that your device is detected by ADB. To do that, type the following command.
adb devices
You should see a list of connected devices, similar to the following.
List of devices attached
BH90TFM516  device
If you see a message different from “device” next to the device (e.g. “no permissions” or “offline”), kill the ADB server by typing adb kill-server and restart it as an administrator.
Creating the Connection
We will now forward a socket connection. The command to type depends on which version of Firefox for Android you use.
If you use the stable version Firefox for Android 35 or later, type:
adb forward tcp:6000 localfilesystem:/data/data/org.mozilla.firefox/firefox-debugger-socket
org.mozilla.firefox must be changed to org.mozilla.firefox_beta if you use the Beta version, to org.mozilla.fennec_aurora if you use Aurora, or to org.mozilla.fennec if you use Nightly.
Finally, if you use Firefox for Android 34 or earlier, type:
adb forward tcp:6000 tcp:6000
Connecting Firefox
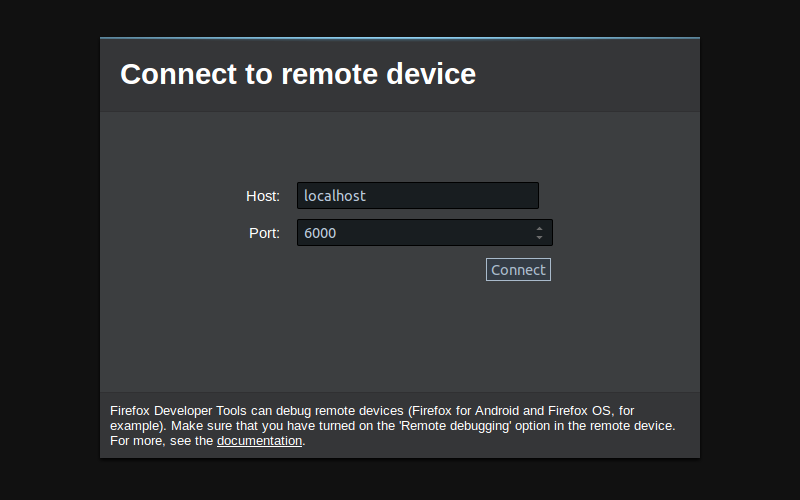
Now you are ready to connect Firefox’s developer tools to Firefox for Android. To do so, open Firefox’s menu and select the “Connect…” entry in the “Web Developer” submenu.
This will open a new tab containing a pre-filled form. The default values should be fine, so submit the form by hitting the “Connect” button.
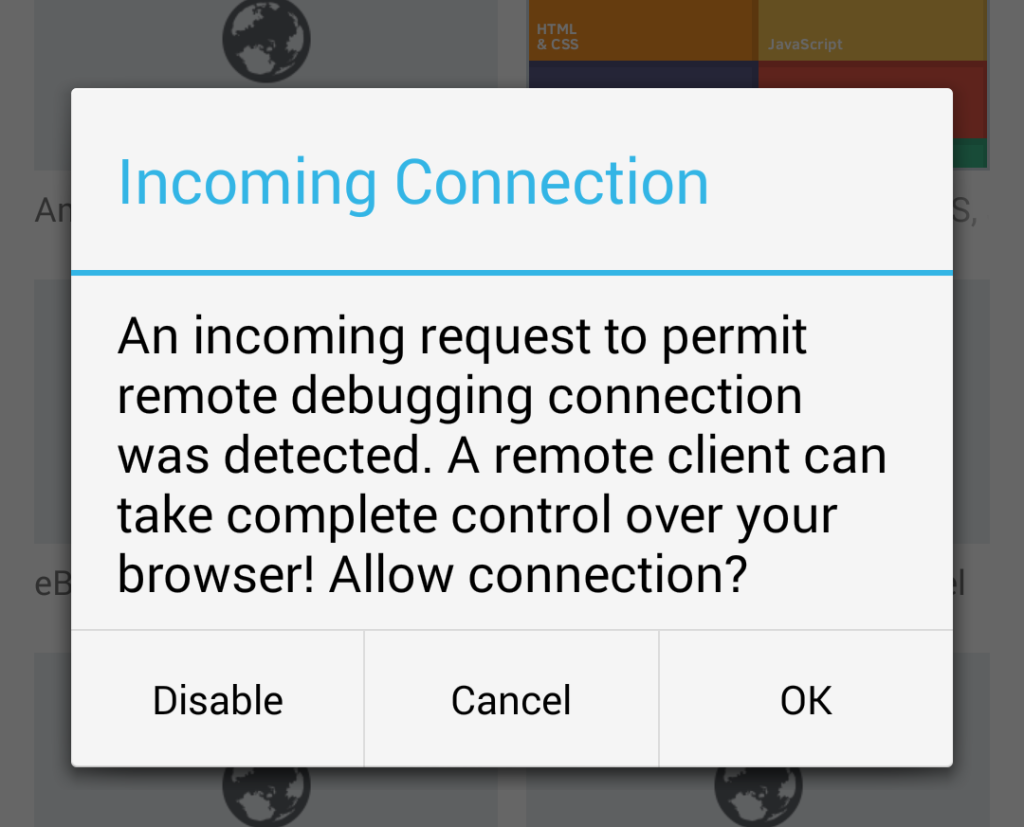
Now, look at your mobile device. You should see a message prompt asking you if you allow the connection. Hit the “OK” button and look at your computer.
You will be able to choose the tab you want to debug. Click on the one you want, and you’re ready to debug it.
Do What You Want!
Choosing a tab will open a new window containing a new toolbox, dedicated to the tab opened on Firefox for Android. Apart from the fact that the target of this toolbox is not on your computer, the tools are the same.
This means you can do anything you want with this toolbox, from viewing and editing the DOM tree to debugging scripts and modifying styles. For example, you can test your connection with the traditional alert('Hello World!'); in the console.
What About Other Browsers?
I develop with Firefox so I chose to present its tools in this article. However, Firefox is not the only browser to provide these tools.
As on a computer, different browsers give different results and different bugs on mobile devices. Firefox’s tools are great, but they are only compatible with Firefox and Firefox for Android.
Chrome
Google Chrome has its own responsive mode, accessible from the developer tools. As with Firefox, you can set a specific resolution but there is no list of resolutions. In place, you can select a specific device (e.g. Google Nexus 5 or Apple iPhone 6). You can also define a user-agent or simulate a type of network, to test if your website take a long time to load on mobile networks.
Chrome gives the possibility to remotely debug Chrome for Android. This tool is similar to Firefox’s as it provides the toolbox you love, but on a mobile website. The way we enable and use remote debugging on Chrome is similar to the one we use with Firefox. You can find the exact steps to follow on Chrome’s official website.
Internet Explorer
Internet Explorer has its own development tools and some of them are dedicated to the mobile world. With these tools, you can see what’s wrong if loading your website is slow on a mobile device. As with Firefox, you can simulate another resolution and, as in Chrome, you can simulate another network. Also, Internet Explorer allows you to simulate a specific geographic position.
Microsoft’s browser don’t have a tool like remote debugging, but it is compatible with weinre.
What experiences and tips do you have working with remote debugging features in Web Browsers?
Frequently Asked Questions (FAQs) on Debugging Mobile Websites with Firefox
How Can I Install Firefox Developer Tools on My Android Device?
Firefox Developer Tools are not directly available on Android devices. However, you can use Firefox’s Remote Debugging feature to connect your Android device to your desktop version of Firefox. This allows you to debug your mobile website using the developer tools available on the desktop version. To do this, you need to enable USB debugging on your Android device, connect it to your computer, and then set up the connection in Firefox.
What Are the Key Features of Firefox Developer Tools for Mobile Debugging?
Firefox Developer Tools offer a range of features for mobile debugging. These include an Inspector to examine and modify HTML and CSS, a Console for JavaScript debugging, a Network Monitor to track requests and responses, and a Responsive Design Mode to simulate different screen sizes. You can also use the Performance tool to analyze your website’s speed and efficiency.
How Can I Use Firefox’s Remote Debugging Feature?
To use Firefox’s Remote Debugging feature, you first need to enable USB debugging on your Android device. Then, connect your device to your computer using a USB cable. In Firefox on your computer, go to the Web Developer menu and select ‘Remote Debugging’. You should see your device listed. Click ‘Connect’ to start debugging.
Why Can’t I See My Device in the Remote Debugging List?
If your device is not showing up in the Remote Debugging list, make sure you have enabled USB debugging on your Android device. Also, check that your device is properly connected to your computer. If you’re still having trouble, try restarting both your device and Firefox.
How Can I Simulate Different Screen Sizes in Firefox?
Firefox’s Responsive Design Mode allows you to simulate different screen sizes. To access this feature, go to the Web Developer menu and select ‘Responsive Design Mode’. You can then choose from a range of preset screen sizes, or enter your own custom dimensions.
How Can I Analyze My Website’s Performance with Firefox Developer Tools?
The Performance tool in Firefox Developer Tools allows you to analyze your website’s speed and efficiency. This tool records activity on your website, allowing you to see how long different tasks take and identify any potential bottlenecks. To use the Performance tool, go to the Web Developer menu and select ‘Performance’.
Can I Debug JavaScript on My Mobile Website with Firefox?
Yes, you can debug JavaScript on your mobile website using Firefox’s Console. The Console shows you any errors or warnings related to your JavaScript code. You can also use it to run JavaScript commands and see their output.
How Can I Modify HTML and CSS on My Mobile Website with Firefox?
Firefox’s Inspector allows you to examine and modify the HTML and CSS of your mobile website. To use the Inspector, go to the Web Developer menu and select ‘Inspector’. You can then click on any element on your website to view and edit its HTML and CSS.
Can I Track Requests and Responses with Firefox Developer Tools?
Yes, the Network Monitor in Firefox Developer Tools allows you to track all requests and responses made by your website. This can help you identify any issues with your website’s communication with the server.
Are There Any Add-Ons That Can Enhance Firefox’s Mobile Debugging Capabilities?
While Firefox Developer Tools offer a comprehensive set of features for mobile debugging, there are also several add-ons available that can enhance these capabilities. For example, the ‘MobiDevTools’ add-on provides additional tools for mobile development and debugging.
 Jérémy Heleine
Currently a math student, Jérémy is a passionate guy who is interested in many fields, particularly in the high tech world for which he covers the news everyday on some blogs, and web development which takes much of his free time. He loves learning new things and sharing his knowledge with others.