
Key Takeaways
- Apache’s Web logging features are flexible for managing single or multiple websites requiring Web log analysis. For a single site, Apache is mostly configured for logging in the default install.
- Apache allows customization of log formats, enabling specific tracking of accesses to your Website, the browsers used to access the site, and referring URLs that your site visitors have arrived from. For multiple sites, identification of individual log files for each domain is a common practice.
- Apache recommends a special single log file for large virtual host environments, providing a tool for generating individual logs per individual domain. This method allows all domains to compile into one log file, which can then be split into individual log files for analysis.
- Log rotation is crucial for high traffic sites to manage large log files and conserve valuable disk space on your server. Apache provides a rudimentary shell script for log rotation, which moves the current Web log to an archive log, compresses the old file, and keeps an archive for up to 12 months.
One of the many pieces of the Website puzzle is Web logs. Traffic analysis is central to most Websites, and the key to getting the most out of your traffic analysis revolves around how you configure your Web logs.
Apache is one of the most — if not the most — powerful open source solutions for Website operations. You will find that Apache’s Web logging features are flexible for the single Website or for managing numerous domains requiring Web log analysis.
Author’s Note: While most of this piece discusses configuration options for any operating system Apache supports, some of the content will be Unix/Linux (*nix) specific, which now includes Macintosh OS X and its underlying Unix kernel.
For the single site, Apache is pretty much configured for logging in the default install. The initial httpd.conf file (found in /etc/httpd/conf/httpd.conf in most cases) should have a section on logs that looks similar to this (Apache 2.0.x), with descriptive comments for each item. Your default logs folder will be found in /etc/httpd/logs. This location can be changed when dealing with multiple Websites, as we’ll see later. For now, let’s review this section of log configuration.
ErrorLog logs/error_log
LogLevel warn
LogFormat "%h %l %u %t "%r" %>s %b "%{Referer}i" "%{User-Agent}i"" combined
LogFormat "%h %l %u %t "%r" %>s %b" common
LogFormat "%{Referer}i -> %U" referer
LogFormat "%{User-agent}i" agent
CustomLog logs/access_log combinedError Logs
The error log contains messages sent from Apache for errors encountered during the course of operation. This log is very useful for troubleshooting Apache issues on the server side.
Apache Log Tip: If you are monitoring errors or testing your server, you can use the command line to interactively watch log entries. Open a shell session and type
"tail –f /path/to/error_log". This will show you the last few entries in the file and also continue to show new entries as they occur.There are no real customization options available, other than telling Apache where to establish the file, and what level of error logging you seek to capture. First, let's look at the error log configuration code from httpd.conf.
ErrorLog logs/error_logYou may wish to store all error-related information in one error log. If so, the above is fine, even for multiple domains. However, you can specify an error log file for each individual domain you have. This is done in the <VirtualHost> container with an entry like this:
<VirtualHost 10.0.0.2>

DocumentRoot "/home/sites/domain1/html/"

ServerName domain1.com

ErrorLog /home/sites/domain1/logs/error.log

</VirtualHost>
If you are responsible for reviewing error log files as a server administrator, it is recommended that you maintain a single error log. If you’re hosting for clients, and they are responsible for monitoring the error logs, it’s more convenient to specify individual error logs they can access at their own convenience.
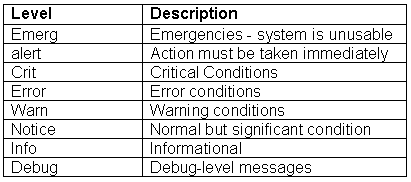
The setting that controls the level of error logging to capture follows below.
LogLevel warnApache’s definitions for their error log levels are as follows:
Tracking Website Activity
Often by default, Apache will generate three activity logs: access, agent and referrer. These track the accesses to your Website, the browsers being used to access the site and referring urls that your site visitors have arrived from.
It is commonplace now to utilize Apache’s “combined” log format, which compiles all three of these logs into one logfile. This is very convenient when using traffic analysis software as a majority of these third-party programs are easiest to configure and schedule when only dealing with one log file per domain.
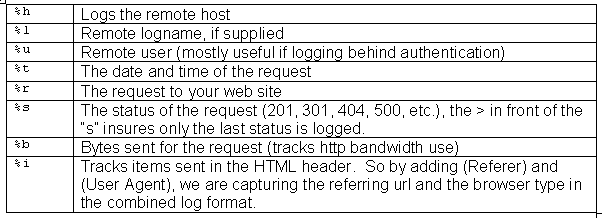
Let’s break down the code in the combined log format and see what it all means.
LogFormat "%h %l %u %t "%r" %>s %b "%{Referer}i" "%{User-Agent}i"" combinedLogFormatstarts the line and simply tells Apache you are defining a log file type (or nickname), in this case, combined. Now let's look at the cryptic symbols that make up this log file definition.
To review all of the available configuration codes for generating a custom log, see Apache's docs on the
module_log_config, which powers log files in Apache.Apache Log Tip: You could capture more from the HTTP header if you so desired. A full listing and definition of data in the header is found at the World Wide Web Consortium.
For a single Website, the default entry would suffice:
CustomLog logs/access_log combinedHowever, for logging multiple sites, you have a few options. The most common is to identify individual log files for each domain. This is seen in the example below, again using the log directive within the <VirtualHost> container for each domain.
<VirtualHost 10.0.0.2>
DocumentRoot "/home/sites/domain1/html/"
ServerName domain1.com
ErrorLog /home/sites/domain1/logs/error.log
CustomLog /home/sites/domain1/logs/web.log
</VirtualHost>
<VirtualHost 10.0.0.3>
DocumentRoot "/home/sites/domain2/html/"
ServerName domain2.com
ErrorLog /home/sites/domain2/logs/error.log
CustomLog /home/sites/domain2/logs/web.log
</VirtualHost>
<VirtualHost 10.0.0.4>
DocumentRoot "/home/sites/domain3/html/"
ServerName domain3.com
ErrorLog /home/sites/domain3/logs/error.log
CustomLog /home/sites/domain3/logs/web.log
</VirtualHost>
In the above example, we have three domains with three unique Web logs (using the combined format we defined earlier). A traffic analysis package could then be scheduled to process these logs and generate reports for each domain independently.This method works well for most hosts. However, there may be situations where this could become unmanageable. Apache recommends a special single log file for large virtual host environments and provides a tool for generating individual logs per individual domain.
We will call this log type the cvh format, standing for "common virtual host." Simply by adding a %v (which stands for virtual host) to the beginning of the combined log format defined earlier and giving it a new nickname of cvh, we can compile all domains into one log file, then automatically split them into individual log files for processing by a traffic analysis package.
LogFormat "%v %h %l %u %t "%r" %>s %b "%{Referer}i" "%{User-Agent}i"" cvhIn this case, we do not make any CustomLog entries in the <VirtualHost> containers and simply have one log file generated by Apache. A program created by Apache called split_logfile is included in the src/support directory of your Apache sources. If you did not compile from source or do not have the sources, you can get the Perl script.
The individual log files created from your master log file will be named for each domain (virtual host) and look like: virtualhost.log.
Log Rotation
Finally, we want to address log rotation. High traffic sites will generate very large log files, which will quickly swallow up valuable disk space on your server. You can use log rotation to manage this process.
There are many ways to handle log rotation, and various third-party tools are available as well. However, we’re focusing on configurations native to Apache, so we will look at a simple log rotation scheme here. I’ll include links to more flexible and sophisticated log rotation options in a moment.
This example uses a rudimentary shell script to move the current Web log to an archive log, compresses the old file and keeps an archive for as long as 12 months, then restarts Apache with a pause to allow the log files to be switched out.
mv web11.tgz web12.tgz

mv web10.tgz web11.tgz

mv web9.tgz  web10.tgz

mv web8.tgz  web9.tgz

mv web7.tgz  web8.tgz

mv web6.tgz  web7.tgz

mv web5.tgz  web6.tgz

mv web4.tgz  web5.tgz

mv web3.tgz  web4.tgz

mv web2.tgz  web3.tgz

mv web1.tgz  web2.tgz

mv web.tgz   web1.tgz

mv web.log   web.old

/usr/sbin/apachectl graceful

sleep 300

tar cvfz web.tgz web.old
This code can be copied into a file called logrotate.sh, and placed inside the folder where your web.log file is stored (or whatever you name your log file, e.g. access_log, etc.). Just be sure to modify for your log file names and also chmod (change permissions on the file) to 755 so it becomes an executable.
This works fine for a single busy site. If you have more complex requirements for log rotation, be sure to see some of the following sites. In addition, many Linux distributions now come with a log rotation included. For example, Red Hat 9 comes with logrotate.d, a log rotation daemon which is highly configurable. To find out more, on your Linux system with logrotate.d installed, type man logrotate.
Log Rotation Sites
For more information on log roation, see:
Frequently Asked Questions (FAQs) about Configuring Web Logs in Apache
What is the importance of configuring web logs in Apache?
Configuring web logs in Apache is crucial for several reasons. Firstly, it allows you to monitor the performance of your website. By analyzing the logs, you can identify any issues or bottlenecks that may be affecting your site’s performance. Secondly, web logs can provide valuable insights into user behavior. You can see which pages are most popular, where your traffic is coming from, and what times of day your site is most active. Lastly, web logs can help with security. By monitoring your logs, you can identify any suspicious activity or potential security threats.
How can I customize my Apache log format?
Apache allows you to customize your log format using the LogFormat directive. This directive allows you to specify exactly what information is logged and how it is formatted. For example, you could choose to log the client’s IP address, the date and time of the request, the HTTP method used, the status code returned, and more. You can also specify the format of the date and time, and include any custom fields you wish.
How can I rotate my Apache logs?
Log rotation is an important aspect of log management. It involves creating new log files at regular intervals, which can help to prevent your log files from becoming too large and unwieldy. Apache provides a utility called rotatelogs for this purpose. You can use this utility to specify how often you want your logs to be rotated, and it will automatically create a new log file at the specified interval.
How can I analyze my Apache logs?
There are several tools available for analyzing Apache logs. These tools can parse your logs and provide reports and visualizations that can help you to understand your data. Some popular options include AWStats, Webalizer, and GoAccess. These tools can provide insights into things like the number of visitors to your site, the most popular pages, the most common referrers, and more.
How can I handle errors in Apache logs?
Apache logs can provide valuable information about any errors that occur on your site. If you see an error in your logs, the first step is to understand what the error message means. Apache error messages are usually quite descriptive, and a quick web search can often provide more information. Once you understand the error, you can take steps to fix it. This might involve modifying your site’s code, adjusting your server configuration, or contacting your hosting provider for assistance.
How can I filter my Apache logs?
Apache allows you to filter your logs using the SetEnvIf directive. This directive allows you to set environment variables based on the characteristics of the request. You can then use these variables to control what information is logged. For example, you could choose to only log requests from a certain IP address, or only log requests that result in a certain status code.
How can I secure my Apache logs?
Securing your Apache logs is important to protect sensitive information. There are several steps you can take to secure your logs. Firstly, you should ensure that your log files are stored in a secure location, and that they are only accessible to authorized users. Secondly, you should consider encrypting your log files to protect them from unauthorized access. Lastly, you should be careful about what information you log. Avoid logging sensitive information like passwords or credit card numbers.
How can I troubleshoot issues using Apache logs?
Apache logs can be a valuable tool for troubleshooting issues with your website. If you’re experiencing a problem, the first step is to check your logs for any error messages. These messages can often provide clues about what’s going wrong. You can also use your logs to monitor the performance of your site, and to identify any unusual activity that might indicate a problem.
How can I manage large Apache log files?
Managing large log files can be a challenge. One approach is to use log rotation, as mentioned earlier. This involves creating new log files at regular intervals, which can help to keep the size of each file manageable. Another approach is to use a log management tool. These tools can help you to analyze and visualize your log data, and can often handle large volumes of data more efficiently than manual methods.
How can I monitor real-time activity using Apache logs?
There are several tools available that can help you to monitor real-time activity using your Apache logs. These tools can provide live updates and alerts based on your log data. Some popular options include GoAccess, Logwatch, and Logstash. These tools can help you to identify issues as they occur, and can provide valuable insights into the performance and security of your site.