
The following is a short extract from our book, Researching UX: Analytics, written by Luke Hay. It’s the ultimate guide to using analytics for improved user experience. SitePoint Premium members get access with their membership, or you can buy a copy in stores worldwide.
For those not used to looking at website analytics, some of the terminology can seem like a foreign language. This can get even more confusing when terms change, or when different tools use different terms to describe the same thing.
Some analytics terms that are used regularly are often misunderstood. In some cases, a partial understanding of a term may be more dangerous than having no understanding at all. One commonly misunderstood example is the word “hit”.
A hit is often thought of as being a synonym for a page view or a visit. This is not the case, as each file request to a web server is an individual hit.
This means that, if a web page contains five images, a user viewing this page will count as one page view but six hits (the five images plus the HTML page itself). You can see how this misunderstanding can lead to a wildly inaccurate understanding of the data! This section covers the most important analytics terms. (There are also short definitions of the main terms in the glossary at the end of this book.)
Dimensions and Metrics
All the data in your analytics reports can be divided into dimensions and metrics. It’s important to know what each term means so that you can better analyze your data. A good understanding of dimensions and metrics is also important for setting up custom reports and dashboards.
Dimensions are a way to group data—a form of categorization or identification. A dimension does not refer to the size of something (a common misunderstanding). Dimensions are normally shown in the first column of your reports. Examples of dimensions include Country, Page Title and Device Type.
Metrics, on the other hand, are the numbers associated with those dimensions. They appear in the other columns of your reports, showing the numbers relating to the dimensions in the first column. Examples of metrics include Pageviews, Bounce Rate and Avg. Time on Page. Metrics help you understand the behavior of your users. They count how often things happen—such as the number of visits to your website or app. Metrics can be totals, averages or percentages of a total.
The screenshot below shows dimensions and metrics, as well as the different ways metrics are counted:
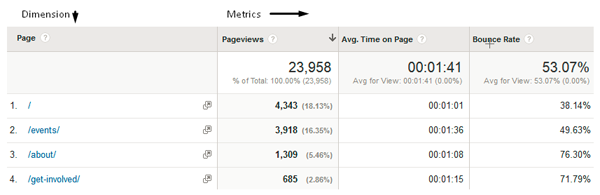
An easy way to differentiate the two is to remember that dimensions are often words, while metrics are more likely to be numbers.
Sessions, Visits, Page Views and Unique Page Views
As touched on in the previous chapter, there is often confusion between sessions, visits and page views. Firstly, it’s worth pointing out that sessions and visits are essentially the same thing. Google Analytics previously used the term “visit”, but changed the terminology to “sessions” in 2014. Other tools, such as Adobe Analytics, still use the term “visits”.
You’ll generally find that the two terms are used interchangeably, but as long as you know these are referring to the same thing, it shouldn’t be a problem.
A session, or visit, is a group of interactions (or a single interaction) that a user takes within a given time frame on your website. Google Analytics sessions time out after 30 minutes of inactivity by default, though you can change this yourself in your analytics settings.
This means that, if your user goes to make themself a coffee, leaving your website open in their browser, and returns within half an hour, this will be counted as the same session. The same can be said for users who hop between multiple tabs. More often than not, though, sessions represent continuous browsing of your website.
Sessions don’t differentiate between unique individuals. They only count the number of sessions, regardless of who’s doing them. If I visit your website in the morning and come back in the evening, that would still count as two sessions. Using other metrics like users or visitors will give you information on about individuals who visit your website. The next section in this chapter covers users and visitors in detail.
Page views are simply views to an HTML page or, less commonly, virtual page views. A virtual page view is a way of telling Google Analytics to register a page view if a new HTML page has not been loaded. Virtual page views require additional tagging in the form of JavaScript code. You can use them everywhere where content is loaded without a reload of the page, or when two or more pieces of content can reside on the same URL—for example, a form submission, or one-page checkouts.
You can have multiple page views during one session if a user is browsing your website. Page views are normally categorized as page views and unique page views. If a user views the same page more than once during a session, this will only count as a single unique page view. This is useful if you want to get an idea of how many sessions included a view to a particular page, but you don’t want that number inflated by users who returned to that page in the same session.
Users and Visitors
As Uxers, we have a good idea of what a “user” is. In our industry, users would generally be defined as individual humans who interact with our product—often a website, app or a piece of software. Analytics packages rarely have a way of accurately identifying individuals, though, so in analytics the term “user” has a slightly different meaning from the normal one.
Most of the major analytics tools will identify users based on cookies. If I visit your website from my laptop, your analytics tool will normally drop a cookie into my browser so that, when I return, it will recognize me as the same individual who visited previously.
This is broadly correct, but it doesn’t take into account that I might share my laptop with someone else. This means that two different individuals can be counted as the same user. Conversely, analytics tools are often unable to identify cross-device (or cross-browser) visits. If I visit your website from my tablet, your analytics tool will be unlikely to identify me as the same user who visited from my laptop.
If you have a website that requires users to log in, or uses some other sort of unique identifier such as an email address or mobile number, then this may enable you to track users across devices. This requires additional setup, though, and relies on users logging in or otherwise identifying themselves on each of their devices.
As with sessions and visits, “users” and “visitors” are generally different terms for the same thing. Different tools will use different terminology, but as long as you remember that visitors and users both normally describe a theoretical individual, based on a cookie, then that’ll be good enough.
Users, or visitors, are often broken down into “new” and “returning”. New visitors are people who have visited your website for the first time during your reporting period, while returning visitors have visited more than once. By breaking this down, your analytics tool enables you to easily compare the behavior of these two user groups.
You need to be careful here, though, as the metrics “new” and “returning” may not be as accurate as you’d expect. As touched on previously, analytics packages rarely track cross-device visits. This means that, if I start something on my phone and finish it on my laptop, it’s likely that I’ll be recorded as a “new” user when I visit via my laptop. Also, users will be recorded as “new” if they clear their cookies, or have a JavaScript or ad blocker installed.
Visit/Session Duration and Time on Page
Time-based metrics are notoriously inaccurate. This is partly due to the way they’re calculated, and partly due to the inability to track a user’s attention.
Google Analytics calculates session duration as the time between the first and last interaction during a visit to your website. It does not, as you might expect, calculate the duration based on when the user arrives on your website and when they leave. Google Analytics has no way of knowing when a user exits your website; it can only track their interactions while they’re on it. This means that, if a user spends five minutes looking at your home page, 20 minutes reading a blog post, and then exits the website, their visit duration was just five minutes. Conversely, if a user has left your website open in another tab for ten minutes while they browse another site, as long as they return to your site and move on to another web page, that ten minutes will count towards their duration on your site!
Time-on-page metrics work in a similar fashion to session duration. The timer starts when a user first loads a particular page and stops when they move on to another page on the website. No time is recorded for that page if a user exits your website from there. This means that a user can read a long blog post on your website, but if they exit from that point before viewing any other pages, their recorded “time on page” will be zero seconds. If a user only visits a single page during their session, both their time on that page and their session duration will be registered as zero seconds.
All of this means that time-based metrics are not very accurate at all.
This underlines the importance of analyzing based on trends over time, rather than looking at exact figures. If your average session duration is five minutes, that may not tell you very much. You’re better off focusing on what the session duration was last month, or last year, and analyzing whether this has gone up or down—and, most importantly, finding out why.
You need to be careful here, though. If, for example, a blog post on your website gets lots of attention on social media one month, and drives lots of users who just read the post, then leave, this alone could massively impact your average session duration. This underlines the need to be aware of what’s happening across all of your website, and to avoid focusing on the headline figures.
Bounce and Exit Rates
Two metrics that often get confused are bounce and exit rates. These are reported in slightly different ways in different analytics tools. The definitions below are based on how they’re reported in Google Analytics.
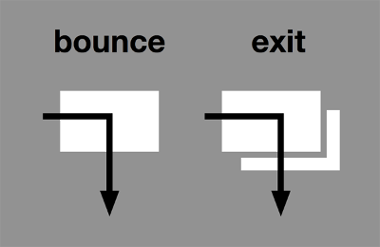
A bounce describes a single page visit to a website. This means that the user arrives on a page and then leaves without viewing any other pages. The bounce rate is the percentage of visits to a website, or web page, that were bounces. A bounce rate of 10% means that one in ten of your website visitors only visited one page during their session. It’s the same for individual pages. If your “about” page has a bounce rate of 50%, this means 50% of the sessions that included a visit to this page were single page visits.
The exit rate for a page shows the percentage of visits to the page that ended with users exiting the site from there. The diagram below shows how bounces and exits differ.
These two metrics are similar, but it’s important to understand the difference between them. The bounce rate for a page is largely affected by the number of people who enter the website on that page. Often exit rate is a more useful metric to use for this reason.
It’s worth mentioning that a high bounce or exit rate isn’t always a bad thing. Users may land on a page, get the information they were looking for, and then leave happy. An example of this could be a user landing on the contact page of your website, finding your phone number and calling you. In this case, the user has achieved their objective quickly and efficiently.
We’ll cover how best to use bounce and exit rates in your analysis later on. For now, though, just make sure you know the difference between the two.
Conversions and Goals
As described in the previous chapter, a goal is a notable action taken by a user on your website, or an action that’s taken off-site, but fed into your analytics tool. An example of this could be a phone call, if you have call tracking software running on your website.
A goal could be as simple as viewing a particular page, or completing a particular form. Goals are often referred to as “conversions”, but they’re actually just one type of conversion. In Google Analytics, conversions also refer to purchases on ecommerce websites.
People often talk about a website’s conversion rate. In Google Analytics, this is the percentage of visits that include a conversion—a user either triggering a goal or completing an ecommerce transaction. In other tools it may also refer to the percentage of unique users who have completed a conversion.
If the website in question is an ecommerce site, the term conversion will normally just refer to purchases. If the website isn’t an ecommerce site, the conversion rate can either be a combined rate for all goals, or the conversion rate of the most important or primary goal.
As there’s no consistent definition of what activity the conversion rate refers to, it’s always good to check what someone means when they use the term.
A conversion is simply moving someone from one state to another. For example, moving someone who hasn’t made a purchase to someone who has. Or even moving someone who doesn’t like your brand to someone who does. Each desired conversion should be measurable in one way or another, and a goal or series of goals can be used to do this in analytics.
Segments and Filters
Analytics tools will generally provide options for segmenting or filtering your data. Segmentation describes grouping users with similar characteristics and viewing the data for those groups, often in comparison with other groups. An example would be segmenting your users by the device they used to visit your website—that is, by mobile, tablet or desktop. Filtering has a similar purpose, but it removes data from a certain group, or groups, leaving you with only the data from the group(s) that you want to collect.
In Google Analytics, filters and segments are separate options, but are often confused with each other.
Filters are applied at the view level of an account, and filter out information from ever being recorded in your reports. For example, if you filter out visits from your IP address for a view, that data simply won’t be collected for that view. Filters are useful for excluding data that may otherwise skew your reports in ways you don’t want.
Segments are applied at report level, and temporarily filter out information from all reports. For example, you might want to create a segment for mobile users from France. Once this segment is applied, all of your reports will only include data for French mobile users. The segment will stop being applied either when you manually remove it, or when you close Google Analytics and return. Segments can be really useful for analyzing the behavior of different user groups. We’ll cover segmenting data in more detail later in this chapter.
Frequently Asked Questions (FAQs) about Key Terms in Analytics
What is the difference between dimensions and metrics in analytics?
Dimensions and metrics are two fundamental aspects of analytics. Dimensions are the descriptive attributes of data, such as the city or the browser type a user is using. They provide context to the numerical data, or metrics, which are the quantitative measurements of data, such as the number of page views or the bounce rate. Together, dimensions and metrics provide a comprehensive view of a website’s performance.
How can I use dimensions and metrics to improve my website’s performance?
By analyzing the dimensions and metrics of your website, you can gain insights into user behavior and website performance. For example, if you notice a high bounce rate on a particular page, you might need to improve the content or layout of that page. Similarly, if a specific city has a high number of users, you might want to tailor your content or marketing efforts to that demographic.
What are some common metrics used in analytics?
Some common metrics used in analytics include page views, sessions, users, bounce rate, and conversion rate. These metrics provide valuable information about user behavior and website performance. For example, a high bounce rate might indicate that users are not finding what they’re looking for on your website, while a high conversion rate might indicate that your marketing efforts are effective.
What are some common dimensions used in analytics?
Some common dimensions used in analytics include city, browser, operating system, and source/medium. These dimensions provide context to the metrics, helping you understand where your users are coming from and how they’re interacting with your website.
How can I customize dimensions and metrics in Google Analytics?
Google Analytics allows you to customize dimensions and metrics to better suit your needs. You can create custom dimensions to track specific user attributes, such as user preferences or demographic information. Similarly, you can create custom metrics to measure specific user interactions, such as clicks on a particular button or downloads of a specific file.
What is the importance of understanding dimensions and metrics in analytics?
Understanding dimensions and metrics is crucial for making data-driven decisions. By analyzing these elements, you can gain insights into user behavior, website performance, and marketing effectiveness. This information can help you optimize your website, improve your marketing efforts, and ultimately, grow your business.
How can I interpret the data from dimensions and metrics?
Interpreting data from dimensions and metrics involves analyzing the numbers and understanding what they mean in the context of your website and business goals. For example, a high number of page views might indicate that your content is popular, but a high bounce rate might suggest that users are not finding what they’re looking for.
Can dimensions and metrics be used in other areas besides website analytics?
Yes, dimensions and metrics can be used in many areas of business, not just website analytics. For example, they can be used in marketing to measure the effectiveness of campaigns, in sales to track performance, and in customer service to monitor satisfaction levels.
What are some best practices for using dimensions and metrics in analytics?
Some best practices for using dimensions and metrics in analytics include setting clear goals, choosing relevant dimensions and metrics, regularly reviewing and analyzing the data, and making data-driven decisions. It’s also important to keep in mind that while dimensions and metrics provide valuable insights, they are just one piece of the puzzle and should be used in conjunction with other data and insights.
How can I learn more about dimensions and metrics in analytics?
There are many resources available to learn more about dimensions and metrics in analytics. Google offers a free Analytics Academy, which provides comprehensive courses on various aspects of analytics. There are also many blogs, books, and online courses available on the topic. Additionally, experimenting with analytics on your own website can be a great way to learn and gain hands-on experience.
 Luke Hay
Luke Hay is a UK-based UX Consultant who’s been working with websites since the 1990s. He prides himself on taking a user-centric, analytical approach to design, development and optimization of websites and apps. Luke currently splits his time between working as the Senior User Researcher at digital transformation agency Clearleft, and as a freelance UX and analytics consultant and trainer. Always involved in his local digital community, Luke has helped organize and curate events for UX Brighton, and is one of the organizers of UX Camp Brighton.