This article was sponsored by New Relic. Thank you for supporting the sponsors that make SitePoint possible!
There’s no telling when your app might attract a throng of visitors at once – maybe it’s a Hacker News post that’s submitted at a specific second on a specific time of day (as posts there tend to work), maybe it was a particularly well placed Reddit post, and maybe it’s actually good and people noticed it, spreading it virally. Regardless of the reason, massive influxes of visitors are a double-edged sword: they get you what you always wanted – a chance to prove your worth to a large chunk of the internet’s population – but also often bring with them what you always feared: absolute downtime.
There are several ways to try and prevent this – among the most prevalent is deploying your application on a service like Amazon, Google App Engine or Heroku which have the ability to not only scale out and in rapidly at your command, but also support automatic scaling, if you’re not afraid of DDoS attacks also scaling your bills while you’re asleep. These platforms usually offer plugins that can optimize your application while it’s up, so you can fine tune it as you go along, but why not try and predict issues while still developing locally and save yourself time, money and effort in the long run?
Apache Benchmark
ApacheBench (also known as “ab”, the command you run it with) is a tool designed to nuke an endpoint with requests and load-test web servers. It supports a wide array of parameters and options you can tweak to simulate different loads, like number of requests, number of concurrent requests, extra headers, falsified cookies, and more.
ab is often included with every Apache installation, but if not, you can easily install it by running sudo apt-get install apache2-utils. The current version of Laravel Homestead doesn’t have it, so if you’re following along please install it into that VM when you vagrant up and connect through SSH.
You can verify you have it installed by just running ab, which should produce a list of supported options:
For our demonstration, I created a subfolder Laravel under Code in the VM, added a subfolder called “public”, and put an index.php file inside with the following content:
<?php
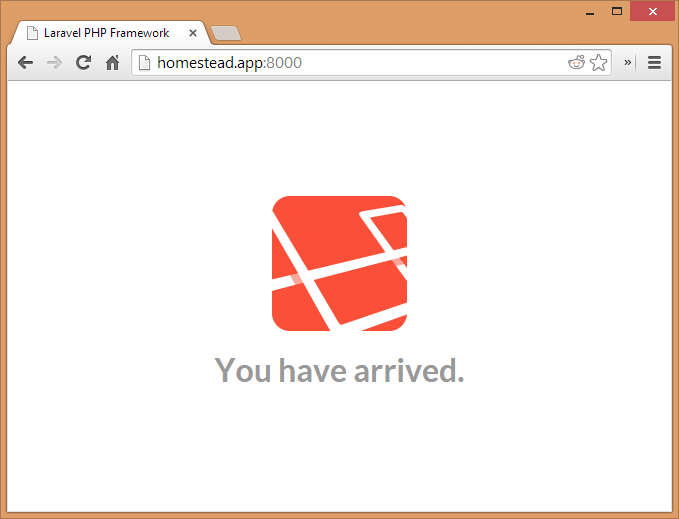
echo "Hello Test";In homestead.yaml, I called this site “homestead.app”, and in my hosts file on my host machine I added 127.0.0.1 homestead.app. This allows me to run sites hosted on the Homestead VM from the host machine’s browser via http://homestead.app:8000, all standard stuff we covered before. However, this also allows you to curl homestead.app from inside the VM – something we can take advantage of when bombing our app with ab.

Test run
For starters, let’s try and nuke our homestead.app with a sample ab grenade – just run ab on the URL, without any options. Note that you must follow the URL with a slash, otherwise you’ll get an invalid URL error from ab.
ab homestead.app/
We can see the benchmark finishes almost instantly – the number of requests per second and concurrency load is too unreal and simple to yield useful results. In fact, running the bench multiple times will produce results from 50 to 200 possible requests per second. To provide some more tangible results, we need to up our game.
Demo app
Go outside the Laravel folder and remove it entirely with rm -rf Laravel. Next, we’ll create a default sample Laravel application with all dependencies. If you don’t have Composer installed globally yet, do it, it’s easy and fast. Then, run the following command:
composer create-project laravel/laravel Laravel --prefer-distThis will download the Laravel skeleton, all dependencies, and generate the autoload and lock files that are needed. You can verify it works by going to http://homestead.app:8000 on your host machine, or curling homestead.app inside the VM:
Let’s tweak the basic bench command and properly step on our app’s toes. Run ab -n 500 -c 100 homestead.app/ to make a more realistic test. The n param means “number of requests”, while c is concurrency, as in, how many requests at a time. Thus, this command will execute 5 batches of 100 simultaneous requests.
The default result format you get at the end of the output will tell you how many requests (in percentage) were executed within a given timeframe, 10 by 10 per cent from 50% to 100%. In other words, if the first row is 50% 3200, that means half the total requests were executed within 3.2 seconds. For 250 requests, this isn’t bad, especially on such a weak machine.
Let’s try and slow things down on purpose. Go into app/controllers/HomeController.php and change the showWelcome function to this:
    public function showWelcome()
    {

        if (isset($_GET['slower']) && $_GET['slower'] == 'true') {
            sleep(1);
        } else {
            usleep(1);
        }

        return View::make('hello');
    }
If you’d like to get some more consistent results, feel free to remove the call to Google Fonts from hello.php, as that removes the downloading lag when fetching the font and leaves everything in the hands of the VM, locally. Also, in the routes.php file, replace the current closure based route with this:
Route::get('/', 'HomeController@showWelcome');Now try benching two different URLs: homestead.app and homestead.app?slower=true. As expected, you’ll notice the results differ wildly. This was a completely ridiculous example, but it’s enough to demonstrate the effect a long running script can have on your visitors when they flock in en-masse. If you have long running scripts like these, it’s much better to delegate them to the background via message queues or other means, and make sure your client-facing script is as fast as you can make it.
Conclusion
In this introduction to ApacheBench, we saw how much of an effect script efficiency had on huge traffic surges. We’ll be adding more ab tutorials further down the line, but in the meanwhile, all you should take away from this is – don’t underestimate small optimizations. There is the potential of premature optimization, but if you can detect and remove the boulders from the path sooner, the road will be smoother in the long run. Play around with ab, test it out, switch out parameters and options, add database connections to the sample Laravel app we played around with – break it, fix it, break it again. Let us know what you find – we’d love to publish your advanced use cases!
Frequently Asked Questions (FAQs) on Stress Testing PHP Apps with ApacheBench
What is ApacheBench and why is it important for stress testing PHP applications?
ApacheBench, often abbreviated as ab, is a command-line tool designed for benchmarking your Apache Hypertext Transfer Protocol (HTTP) server. It is a tool that comes with the standard Apache source distribution and is essential for stress testing PHP applications. It allows you to generate a load on a server and measure the server’s response, providing a clear picture of how your PHP application behaves under different levels of load. This information is crucial in optimizing your application and ensuring it can handle expected traffic levels.
How can I install ApacheBench on my system?
ApacheBench is typically bundled with the standard Apache HTTP server software. If you have Apache installed, you likely already have ApacheBench. If not, you can install it separately using package managers like apt-get for Ubuntu or brew for MacOS. For instance, on Ubuntu, you can use the command sudo apt-get install apache2-utils.
How do I use ApacheBench to stress test my PHP application?
To use ApacheBench, you need to open your command line interface and use the ab command followed by options and the URL of the website you want to test. For example, ab -n 100 -c 10 http://yourwebsite.com/ will send 100 requests to your website in batches of 10 concurrent requests.
What do the results from ApacheBench mean?
ApacheBench provides a lot of data, including the number of requests per second your server can handle (higher is better), the time per request (lower is better), and the total percentage of requests served within a certain time. These metrics give you a sense of your server’s performance and where potential bottlenecks might be.
How can I interpret the ‘Time taken for tests’ in ApacheBench results?
The ‘Time taken for tests’ is the total time ApacheBench took to perform all the requests. It’s a useful metric to understand the overall time efficiency of your server. However, it should be analyzed in conjunction with other metrics like ‘Requests per second’ and ‘Time per request’ to get a comprehensive view of your server’s performance.
What does the ‘Failed requests’ metric mean in ApacheBench?
Failed requests’ refer to the number of requests that the server was unable to fulfill. A high number of failed requests could indicate a problem with your server’s capacity or with the application itself. It’s crucial to investigate and address these failures to ensure your application can handle the desired load.
How can I increase the number of requests and concurrency in ApacheBench?
You can increase the number of requests and concurrency by adjusting the values of the -n and -c options in your ApacheBench command. For example, ab -n 1000 -c 100 http://yourwebsite.com/ will send 1000 requests in batches of 100 concurrent requests.
Can ApacheBench be used for websites using HTTPS?
Yes, ApacheBench supports HTTPS. You can test an HTTPS website by simply replacing “http” with “https” in the URL you provide to the ApacheBench command.
How does ApacheBench compare to other load testing tools?
ApacheBench is a simple and straightforward tool that’s great for quick and easy load testing. However, it lacks some of the advanced features found in other tools, like scripting and scenario testing. Depending on your needs, you might want to use ApacheBench in conjunction with other testing tools.
Can ApacheBench help me identify bottlenecks in my PHP application?
Yes, by analyzing the results from ApacheBench, you can identify potential bottlenecks in your application. For example, if you see a high number of failed requests or a low number of requests per second, it could indicate a problem that needs to be addressed. However, ApacheBench won’t tell you what the specific problem is – you’ll need to use other debugging and profiling tools for that.
 Bruno Skvorc
Bruno is a blockchain developer and technical educator at the Web3 Foundation, the foundation that's building the next generation of the free people's internet. He runs two newsletters you should subscribe to if you're interested in Web3.0: Dot Leap covers ecosystem and tech development of Web3, and NFT Review covers the evolution of the non-fungible token (digital collectibles) ecosystem inside this emerging new web. His current passion project is RMRK.app, the most advanced NFT system in the world, which allows NFTs to own other NFTs, NFTs to react to emotion, NFTs to be governed democratically, and NFTs to be multiple things at once.