Analyzing the performance of your web application is important. There may be bottlenecks that are affecting a certain group of users or there might be errors that haven’t been identified in testing. Often, an application won’t react the same in development or staging compared to the production environment, where 1000s (or more) users hit it concurrently. When the nuances of your production environment show up, you’ll want a way to measure what’s happening. Which requests are slow or falling over? Is there an external system you’re using that is clogging the pipes? Are your users happy or frustrated? Real time performance monitoring is the only way to find the answers to these kinds of questions.
In this article, we’ll look at one way to get those answers. Traditionally, setting up some form of monitoring for an application was difficult and time-consuming. New Relic is an analytics software as a service that provides performance data about your Ruby (or node or .NET or just about any kind of) applications in real time. This allows you to monitor the overall performance and health of your application and keep on top of it’s performance.
Once you have gathered the metrics and analized the charts; you can start to optimize the code and performance of the application based on that feedback. Because it works in real time, New Relic will also help to identify any new problems that are caused when you deploy an update to your application. A big advantage of using New Relic is that all the data is based on real usage of your application and is presented as it happens.
New Relic works by inserting Rack middleware between the server and your application that collects data that is then sent back to the New Relic server. You might be concerned that this in itself creates an ironic performance hit, but it actually makes such a small difference that it isn’t noticeable. The gains from the data collected far outweigh the tiny delay caused in collecting them.
Support
New Relic started life as a Ruby application, so it has very good all around support for different versions of Ruby. It supports all versions of MRI from 1.87 upwards, JRuby from 1.6.0 upwards, and Rubinius from 2.2.1 upwards. There is also good support for most Ruby Web servers, including Passenger, Thin, Puma, Unicorn, Rainbows!, and Webrick. You can use Rails, Sinatra, Padrino, or just a simple Rack application. Database support is also excellent, with Active Record, DataMapper, Sequel and MongoDB all supported.
What We’ll Be Covering
In this post I’ll be going to explain how to build a basic Sinatra application from scratch, deploy it to Heroku, and use the New Relic client to analyze its performance. We’ll cover the following:
- Build a basic Sinatra application
- Deploy to heroku
- Set up New Relic
- Monitor the application in realtime
If you don’t want to deploy your application using Heroku then you can simply go to https://newrelic.com/#signup and sign up for a free account. Once you’ve registered, you’ll be taken to the start page where you follow the instructions to get started. You can also just as easily use a Rails application or any other Rack based framework instead of Sinatra.
Making a Test Application
Let’s start by creating a basic ‘Hello World’-type application. To start, we need to create a Gemfile that contains the following:
source 'https://rubygems.org'
ruby '2.1.0'
gem "sinatra"
gem "newrelic_rpm"

group :test do
  gem "rack-test"
  gem "rake"
end
Install the gems by entering the following in a terminal:
$ bundle installNow create a file called test.rb in the same directory and add the following code:
ENV['RACK_ENV'] = 'test'
require 'minitest/autorun'
require 'rack/test'
require_relative 'main.rb'

include Rack::Test::Methods

def app
  Sinatra::Application
end

describe "Application" do

  it "should say hello" do
    get '/'
    last_response.must_be :ok?
    last_response.body.must_equal "Hello New Relic!"
  end

end
These are fairly standard specs, using MiniTest, to test a very basic response. Now let’s create a file so that these tests pass.
Create a file called main.rb and save it in the same directory with the following code:
require 'sinatra'
require 'newrelic_rpm'

get '/' do
  "Hello New Relic!"
end
Let’s test that it works:
$ ruby test.rb
Run options: --seed 5936

# Running:

.

Finished in 0.086612s, 11.5457 runs/s, 23.0914 assertions/s.

1 runs, 2 assertions, 0 failures, 0 errors, 0 skips
Everything seems to be fine, so let’s deploy it using Heroku. First of all we’ll need to create a config.ru file, saved in the same directory, with the following content:
require './main'
run Sinatra::Application
Now we need to use Git for version control:
$ git init
$ git add .
$ git commit -m 'initial commit'
Create the application using Heroku:
$ heroku createDeploy:
$ git push heroku masterThis will successfully deploy our application to Heroku, so now we’re ready to start using New Relic. We’ll do this using the Heroku client in the terminal:
$ heroku addons:add newrelic:starkThis will install the Stark plan, which includes all the features but is limited to an average of 1.5 dynos per month (you can upgrade to a paid for plan whenever you need to).
Once we’ve installed the New Relic addon, we need to set what app name will be in New Relic. This is done using config variables:
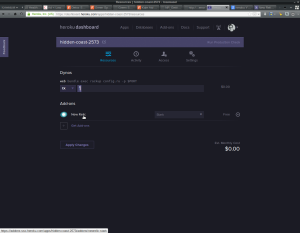
$ heroku config:set NEW_RELIC_APP_NAME="Test Sinatra App"To view the New Relic interface, you will have to go through the Heroku website: Select the application you installed the New Relic addon to then click on New Relic in the List of Addons.
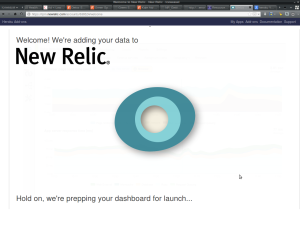
The New Relic interface will then begin to load.
After a few seconds you should see a screen like this:
Click on your application name and you’ll be taken to the Application Monitoring Overview dashboard, which should look something like the screenshot below:
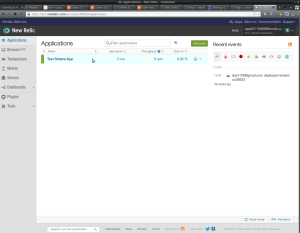
This dashboard shows all the basic information about your application. Unfortuantely, there is not data to show at the moment because the application hasn’t received any requests.
To start seeing some data, our application needs some requests. Since we’ve only just launched it, it’s not likely to have many visitors. Thankfully we can use the Apache Benchmarking tool to generate a large amount of requests. To install this tool in a Debian based operating system you can use the following command:
$ sudo apt-get update
$ sudo apt-get install apache2-utils
We can generate a couple of thousand requests for our application with the following command:
$ ab -n 2000 -c 10 http://hidden-coast-2573.herokuapp.com/Obviously, you should substitute the URL of your own application here!
Let’s head back to the New Relic dashboard and see some data:
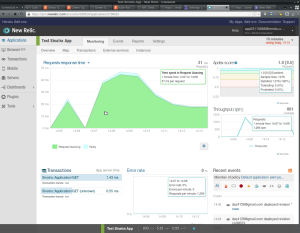
There is a lot of informaton presented here and it can be quite daunting at first. We’re going to start by taking a look at some the basic statistics, such as Response Times, Throughput, Apdex Score, Error Rate and Recent Events. The dashboard defaults to showing statistics for the last 30 minutes, although this can be changed by clicking on the the button in the top right corner that says ‘Last 30 minutes’ and selecting another timeframe.
Response Times, Throughput and Apdex Score
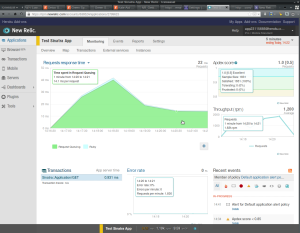
On the Monitoring Overview screen you can see the average request time as a line chart in the top left corner. You can hover, click, and drag anywhere on this graph to get more informaton and zoom in. As you can see in the screenshot, our application currently takes between 10ms and 50ms to process each request.
Throughput is shown on the middle right of the dashboard and represents the number of requests per minute that our application can handle. Looking again at the screenshot above, our application is handling between one and two thousand requests per minute.
In the top right of the dashboard is a metric called Apdex score. This is an industry standard measure of user satisfaction based on page load times. It works by setting a T-Value, which is the threshold time in which a page should be expected to load. New Relic defaults this to 0.5 seconds. The Apdex then tracks how long each page takes to load and categorizes them as:
- Satisfied: The response time is less than or equal to T (0.5 seconds or less)
- Tolerating: The response time is greater than T and less than or equal to 4T (between 0.5 seconds and 2 seconds)
- Frustrated: The response time is greater than 4T (2 seconds or more)
Our pageload time is very quick, giving us an excellent Apdex score.
The Error Rate is shown in the middle bottom of the dashboard and at the moment we are doing well as this is at 0% – no errors at all!
Slowing Things Down
One of the most useful things about NewRelic is that you can make changes and immediately see the effect of them. To see this in action, let’s add another route handler that has a random delay built in. This will make the pages take a little longer to load and we should see the changes reflected in New Relic.
First of all, let’s add an extra spec inside the describe block in the test.rb file:
it "should get there in the end" do
  get '/delay'
  last_response.must_be :ok?
  last_response.body.must_equal "Sorry for keeping you waiting"
end
Add the corresponding route handler to the bottom of main.rb:
get '/delay' do
  sleep rand(3)
  "Sorry for keeping you waiting"
end
This code will add a random delay between 0 and 3 seconds before dispalying the message.
Let’s test to see if the code works:
$ ruby test.rb

Run options: --seed 44113

# Running:

..

Finished in 1.140616s, 1.7534 runs/s, 3.5069 assertions/s.

2 runs, 4 assertions, 0 failures, 0 errors, 0 skips
Everything is working fine, so let’s deploy to Heroku:
$ git commit -a -m 'Added a delay'
$ git push heroku master
Now we need to generate a few requests for this URL:
$ ab -n 2000 -c 10 http://hidden-coast-2573.herokuapp.com/delayThis will take a bit longer than before (because of the built in delay we have created).
Now we can have another look at the results in New Relic:
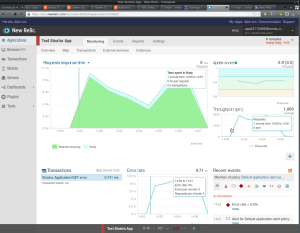
First of all, notice the vertical line on the line graph – this marks when our deployment was made. The deployment also appears as an entry in the ‘Recent events’ column in the bottom right corner.
We now see that the request time is much longer than before. The graph is broken down into two parts – green for request time and blue for Ruby processing time. The big block of blue tells us that the delay is being caused by Ruby, rather than the server. The throughput is now down to between 200 and 500 requests per minute and this has resulted in our Apdex score taking a hit with some of the requests being classified as ‘Frustrated’. A warning will also appear in the Recent events column to say when the Apdex score falls below 0.85.
What’s great about this is that we can see the affect our changes have had immediately after the code has been deployed.
We still have zero errors though, which is something we’ll address in the next section.
Error Reporting
To see how New Relic reports errors, add another route handler that generates a random error 10% of the time. To start, let’s add a spec to the describe block in test.rb:
it "should be fine" do
  get '/error'
  last_response.must_be :ok?
  last_response.body.must_equal "Everything is fine"
end
Then add a route handler to the bottom of main.rb
get '/error' do
  if rand(10) == 0
    raise "A Gremlin has got into the system!"
  else
    "Everything is fine"
  end
end
This will raise a random error 1 in 10 times.
Let’s test the code out:
$ ruby test.rb
Run options: --seed 36091

# Running:

...

Finished in 0.105132s, 28.5355 runs/s, 57.0709 assertions/s.

3 runs, 6 assertions, 0 failures, 0 errors, 0 skips
Everything seems to be okay, so let’s deploy the code:
$ git commit -a -m 'Added an error'
$ git push heroku master
Generate a few requests for this URL:
$ ab -n 2000 -c 10 http://hidden-coast-2573.herokuapp.com/errorLet’s take another look in New Relic:
We can see that the error rate has climbed to 9.71%, which is what we’d expect. Also, an entry in the Recent events column says that the error rate has gone over 5%.
If you click on the ‘Events’ tab along the top and select ‘Errors’, you’ll see a breakdown of all the errors that have occurred. As you can see in the screenshot below, the errors are named, so we can see that the error in our application is “A Gremlin has got into the system!”
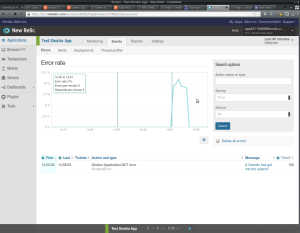
While in the ‘Events’ section, try clicking on ‘deployments’, where you can view a breakdown of all the statistics for each deployment.
Reports
New Relic is able to generate a number of reports to summarise the application metrics. If you click on the ‘Reports’ tab along the top then select ‘SLA’ you can see a ‘Servie Level Agreement’ report that will tell you how many requests have been made per day, what the Apdex score was, the error rate and how many users were satisfied, tolerating, or frustrated.
Summary
That completes this tutorial about how to deploy a basic Ruby application to Heroku and use New Relic to monitor its performance. We’ve looked at how to meaure the response time, throughput, and the Apdex score, as well as how to see changes in these metrics in real time after deploying a code update.
New Relic identified the errors in our application, as well as how slow page load times were being caused by Ruby, rather than the server. The really useful thing about all of this information is that it coming from a live, running application – notice that our application passed all of the tests we ran, despite there being some bugs lurking underneath that we’re only picked up under repeated usage.
Taking Things Further
We’ve only just scratched the surface of what you can monitor with New Relic in this post. Here are some other features that are worth looking into:
- You can set Alerts for certain events, such as when a certain error rate occurs or if the Apdex score falls below a certain level
- You can use the browser tab to monitor end user information, such as browser, operating system and geographic region. This works in a similar way to Google Analytics
- You can monitor the performance of database interactions
- You can monitor the performance of external services
- You can monitor the performance of background processes
- Custom Dashboards are a powerful feature that allow you to create your own dashboards containing customized charts and tables for any particular metrics.
The documenation is very thorough and the help desk is also very responsive, so you should be able to pick up these features quickly once you get started.
Conclusions
Hopefully this post has helped to demonstrate how New Relic helps you to monitor the performance of a Ruby application in real time and provides instant feedback as it happens. This allows you to respond quickly to any problems that might arise after an update.
Are you already using New Relic? Are you thinking of trying it out? If you already use it, which metrics have you found most useful? Let us know in the comments below.
Frequently Asked Questions (FAQs) about Real-time Ruby Monitoring
How does real-time Ruby monitoring work?
Real-time Ruby monitoring works by continuously tracking and analyzing the performance of Ruby applications. It provides insights into various aspects such as response times, error rates, and server load. This is achieved through the use of monitoring tools that collect data from your Ruby applications and present it in an easy-to-understand format. These tools can alert you to any performance issues, allowing you to address them before they impact your users.
What are the benefits of using New Relic for Ruby monitoring?
New Relic offers a comprehensive solution for Ruby monitoring. It provides real-time insights into your application’s performance, helping you identify and resolve issues quickly. With New Relic, you can track everything from database queries to server load, giving you a complete picture of your application’s health. Additionally, New Relic’s intuitive dashboard makes it easy to understand your data, making it a great choice for both beginners and experienced developers.
How does New Relic compare to other Ruby monitoring tools?
New Relic stands out for its comprehensive monitoring capabilities and user-friendly interface. While other tools may offer similar features, New Relic provides a more holistic view of your application’s performance. It also offers advanced features like distributed tracing and synthetic monitoring, which are not commonly found in other tools. However, the best tool for you will depend on your specific needs and budget.
Can I use New Relic for monitoring Ruby on Rails applications?
Yes, New Relic is fully compatible with Ruby on Rails. It can monitor Rails applications in real-time, providing insights into everything from database performance to server load. This makes it a great choice for Rails developers looking to optimize their applications and improve user experience.
How can I get started with New Relic for Ruby monitoring?
Getting started with New Relic is straightforward. After signing up for an account, you’ll need to install the New Relic agent in your Ruby application. This involves adding the New Relic gem to your Gemfile and configuring it with your New Relic license key. Once the agent is installed, it will start collecting data from your application and sending it to New Relic for analysis.
What kind of data can I monitor with New Relic?
New Relic allows you to monitor a wide range of data from your Ruby applications. This includes response times, error rates, server load, database queries, and more. You can also set up custom metrics to track specific aspects of your application’s performance.
Can New Relic help me identify performance bottlenecks in my Ruby application?
Absolutely. New Relic’s detailed performance data can help you identify bottlenecks in your Ruby application. By analyzing this data, you can pinpoint the areas of your application that are slowing down performance and take steps to optimize them.
Is New Relic suitable for large-scale Ruby applications?
Yes, New Relic is designed to handle the demands of large-scale Ruby applications. It can monitor thousands of servers and applications simultaneously, making it a great choice for businesses of all sizes.
How does New Relic’s pricing work for Ruby monitoring?
New Relic’s pricing for Ruby monitoring is based on the number of hosts you need to monitor. They offer a free tier for small applications, with paid plans available for larger applications. For detailed pricing information, you should visit New Relic’s website.
Can I integrate New Relic with other tools I’m using?
Yes, New Relic can be integrated with a wide range of other tools. This includes popular services like Slack, Jira, and AWS, allowing you to streamline your workflow and get the most out of your monitoring data.
 Darren Jones
Darren loves building web apps and coding in JavaScript, Haskell and Ruby. He is the author of Learn to Code using JavaScript, JavaScript: Novice to Ninja and Jump Start Sinatra.He is also the creator of Nanny State, a tiny alternative to React. He can be found on Twitter @daz4126.