
You’ve built a website, but how well does it perform for your end users? It’s crucial to ask this question, but how can you get answers? One excellent option is to use Lighthouse.
Lighthouse allows you to easily and automatically analyze a web page’s performance and quality. It provides tools that let you understand how to improve your web page’s performance, accessibility, SEO and more. Using these scores to enhance your website will ultimately lead to attracting more users and increasing your website’s rank in search engines.
In this article, we’ll explore the importance of website performance, which is the highlight of Lighthouse’s scoring. We’ll also look at why we should use Lighthouse; how to use Lighthouse, both via Chrome and via the Lighthouse CLI; and the various audits Lighthouse can perform to score your web page, and why they’re important. We’ll also cover how some common performance and other website issues can be resolved.
We’ll also look at how to use WebPageTest, another powerful tool for assessing site performance.
Why Performance Is Important
If you look at some of the world’s best websites, they all have one thing in common: they provide their users with a superior experience. There are many reasons for this, but one of the most important ones is performance. Users love a fast website. The longer they have to wait for a website to load, the more likely they’ll leave the website in search of a better one that allows them to do what they need to do without the wait.
Improving your website’s performance can lead to a higher SEO ranking (as we’ll see in more details later in the article), and a boost in click-through and conversion rates. So, if you want more sales, sign-ups, or traffic, you’ll first have to ensure that your website’s performance is up to scratch.
Why Use Lighthouse
Lighthouse is an open-source tool created by Google. As Google is a reputable company that’s trusted by many, it makes the result more reliable than other tools. Furthermore, as Google’s search engine is the leading search engine for the past decade, appearing higher on their search engine will most likely result in more traffic. So, getting a higher score on their performance audit tool can potentially raise the ranking of your website in their search results.
But other than the fact that Lighthouse was created by Google, what makes it a good tool is its detailed results that have the user’s best interest at heart. Lighthouse provides many results concerning how long it takes the page to load, if the page (and ultimately the website) is secure, if the page’s accessibility practices and implementations allow for inclusivity of all users, and more.
How to Use Lighthouse
In this section, we’ll first go through the easiest way to use Lighthouse to analyze and check the score of a web page, which is done directly through Chrome. Then, we’ll check other Lighthouse tools that might provide even more detailed results or options.
Using Chrome
Using Lighthouse through Chrome is the easiest method to measure your website’s performance. First, open any web page that you’d like to measure. To demonstrate, I’ll be using some results from an audit run on my website and on GitHub for us to see a variety of sample results.
Next, open the devtools either by clicking shift + control + J or F12 on Windows/Linux, or option + command + J or fn + F12 on macOS.
After that, click on the Lighthouse tab.
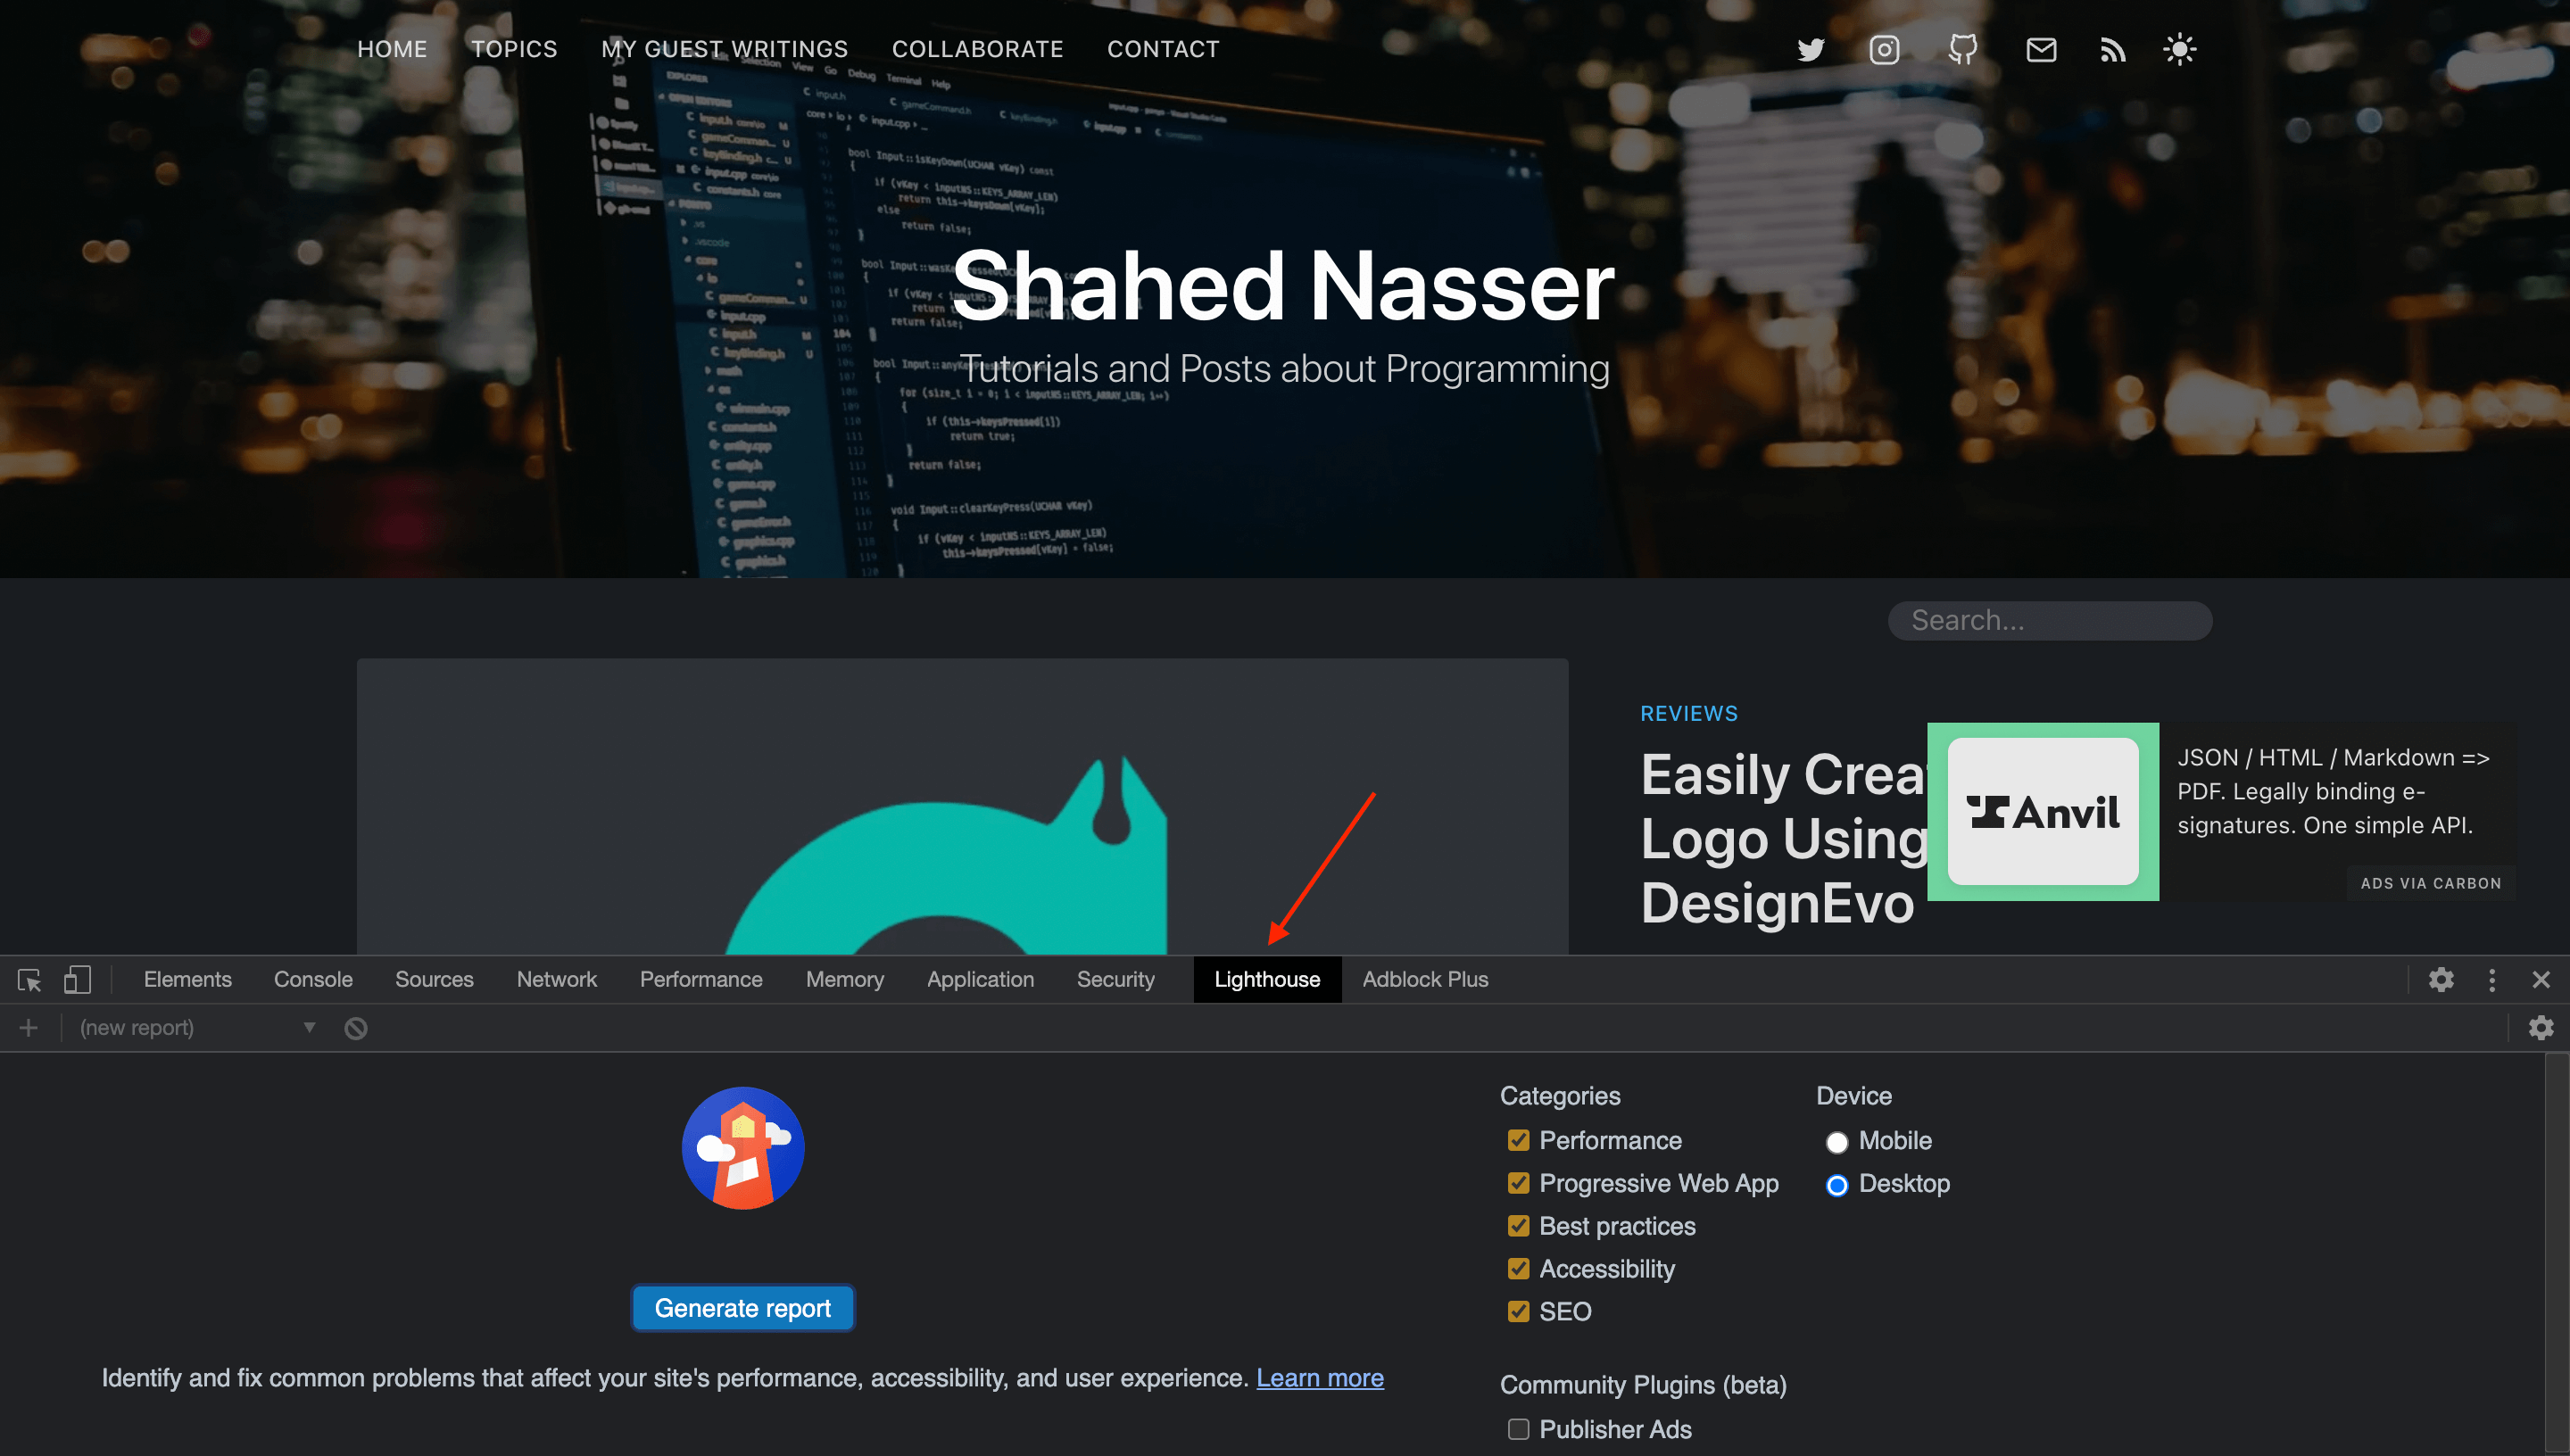
As you can see, you can choose which categories you want the audit to include. These categories are Performance, Progressive Web App, Best Practices, Accessibility, and SEO. You can also choose whether you want the audit to run on Mobile or Desktop.
In this section, we’ll perform four audits which are Performance, Best Practices, Accessibility, and SEO, and we’ll run them on Desktop. However, to achieve optimal results, it’s important to test your web page under different conditions — such as on Mobile and at different internet speeds.
So, on the web page you want to measure, go ahead and choose the four categories mentioned and Desktop, then click Generate Report.
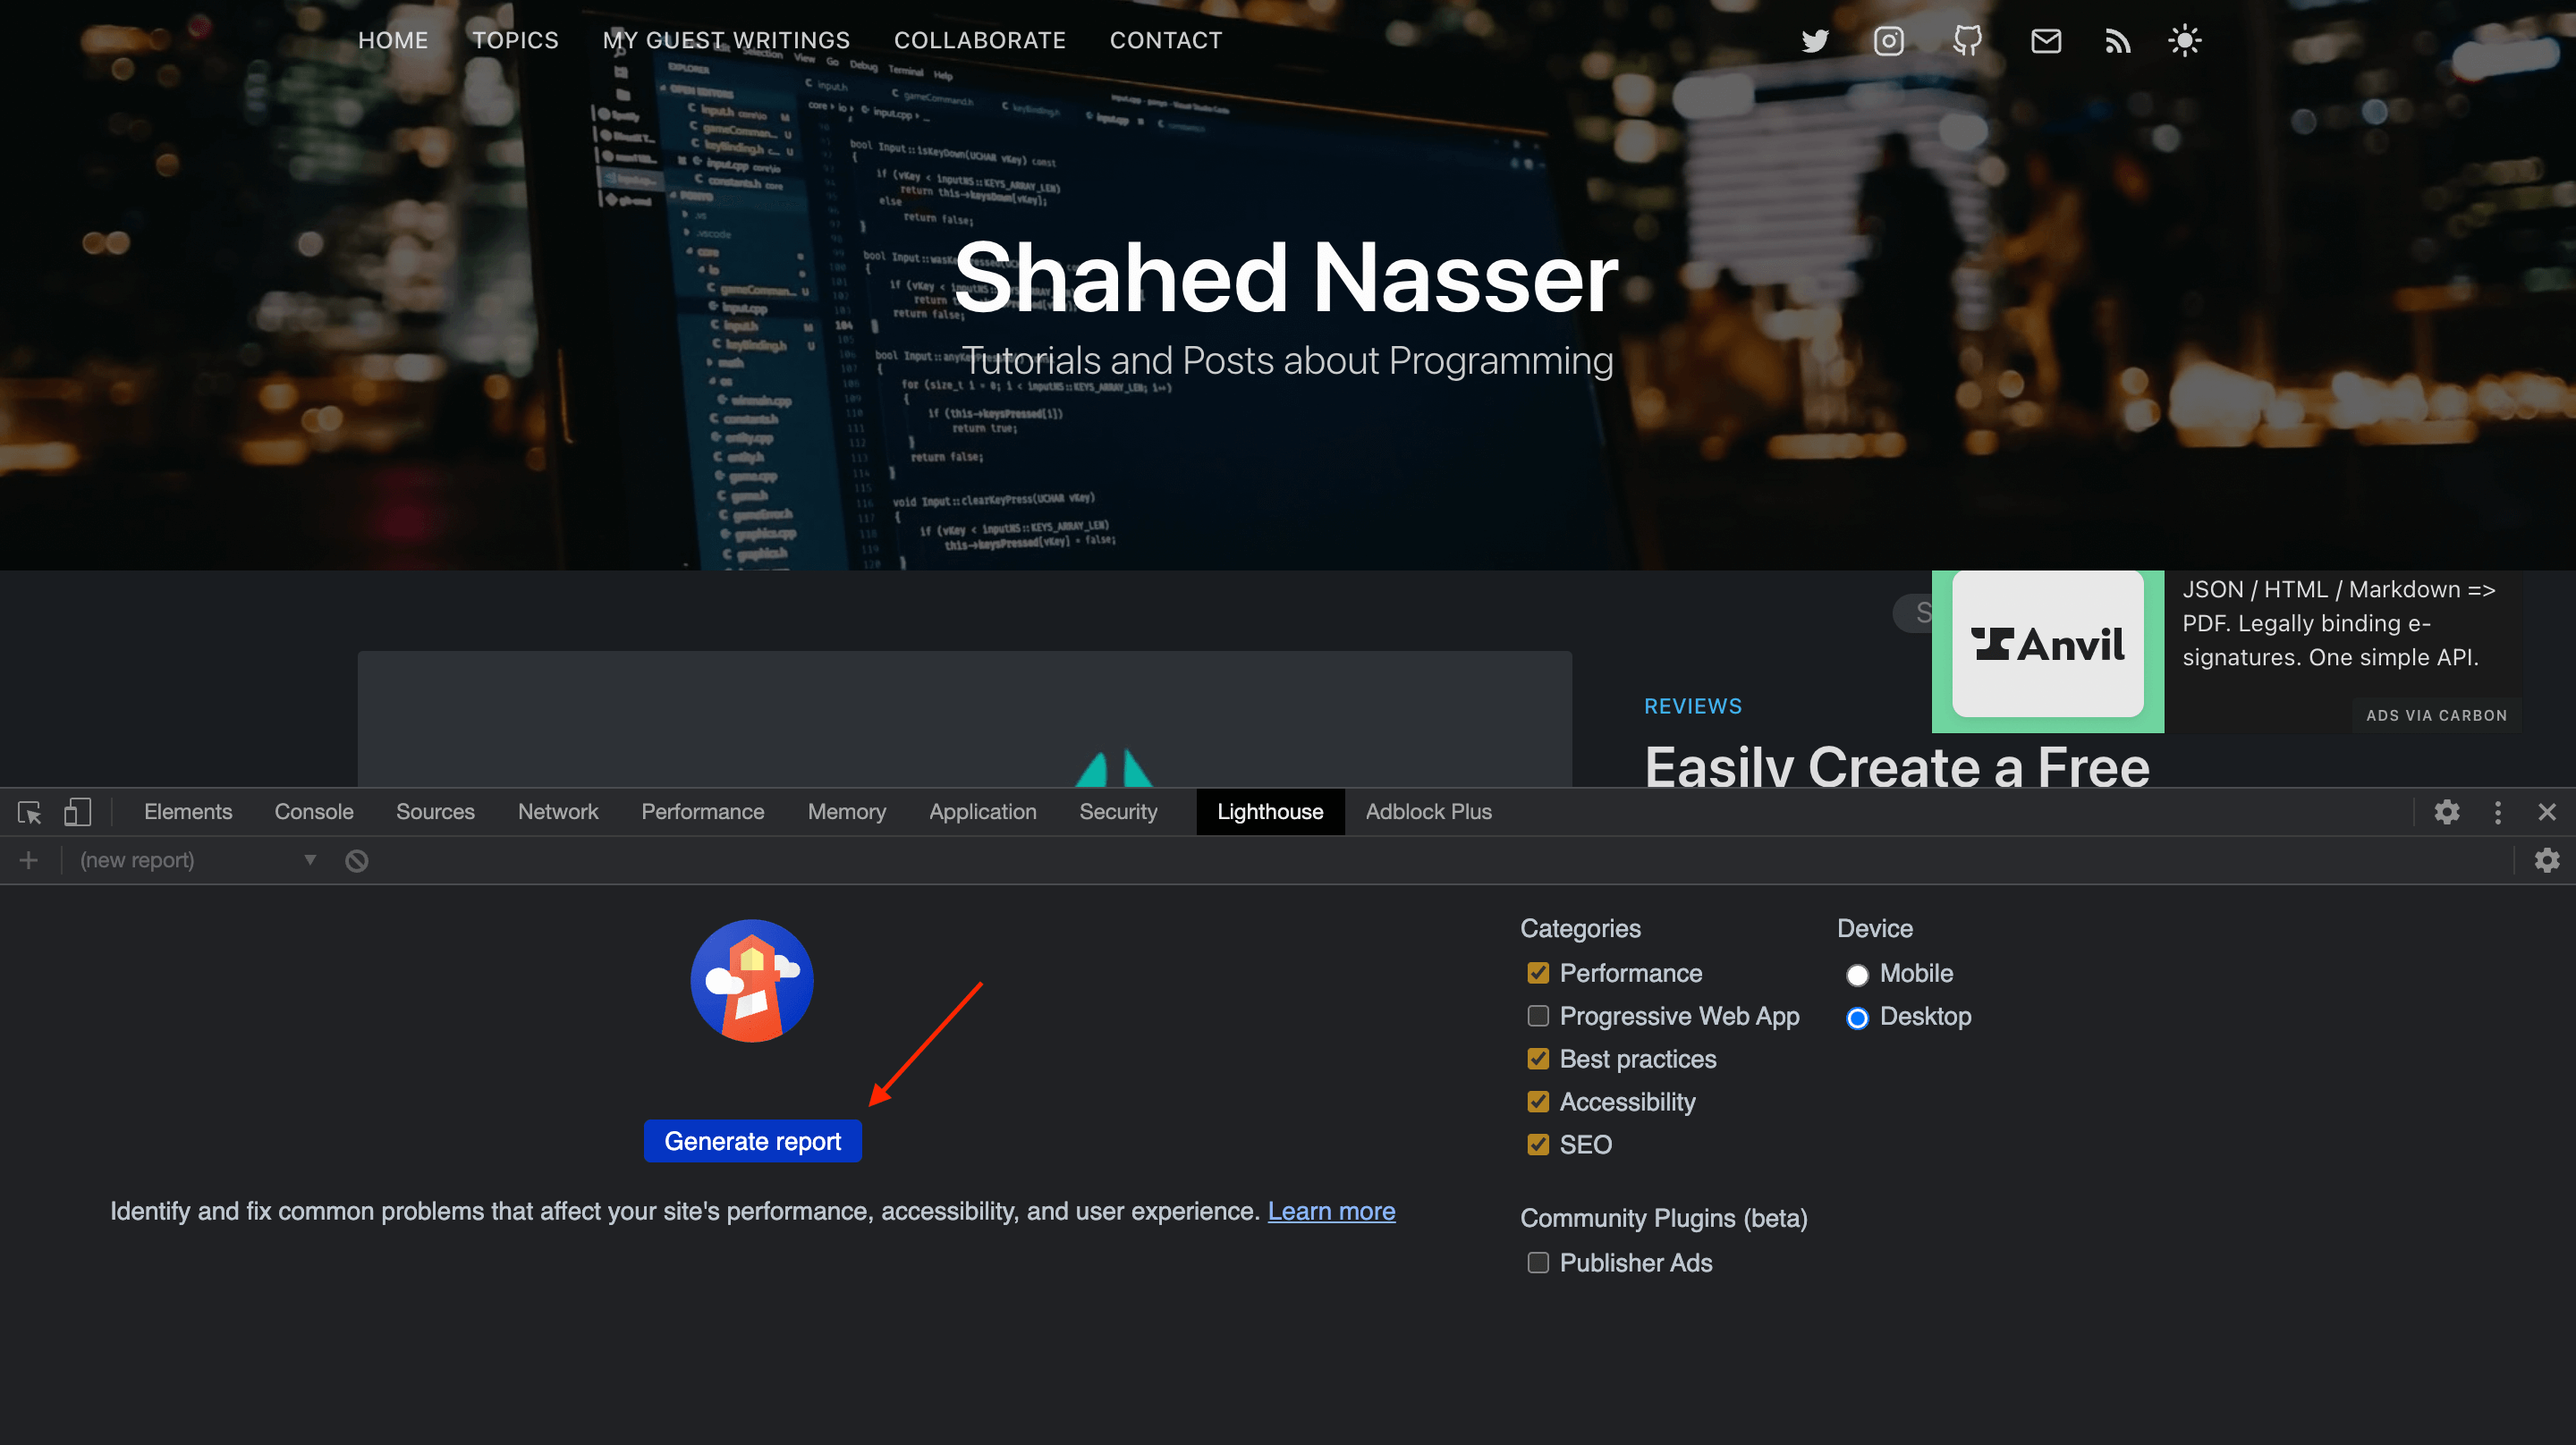
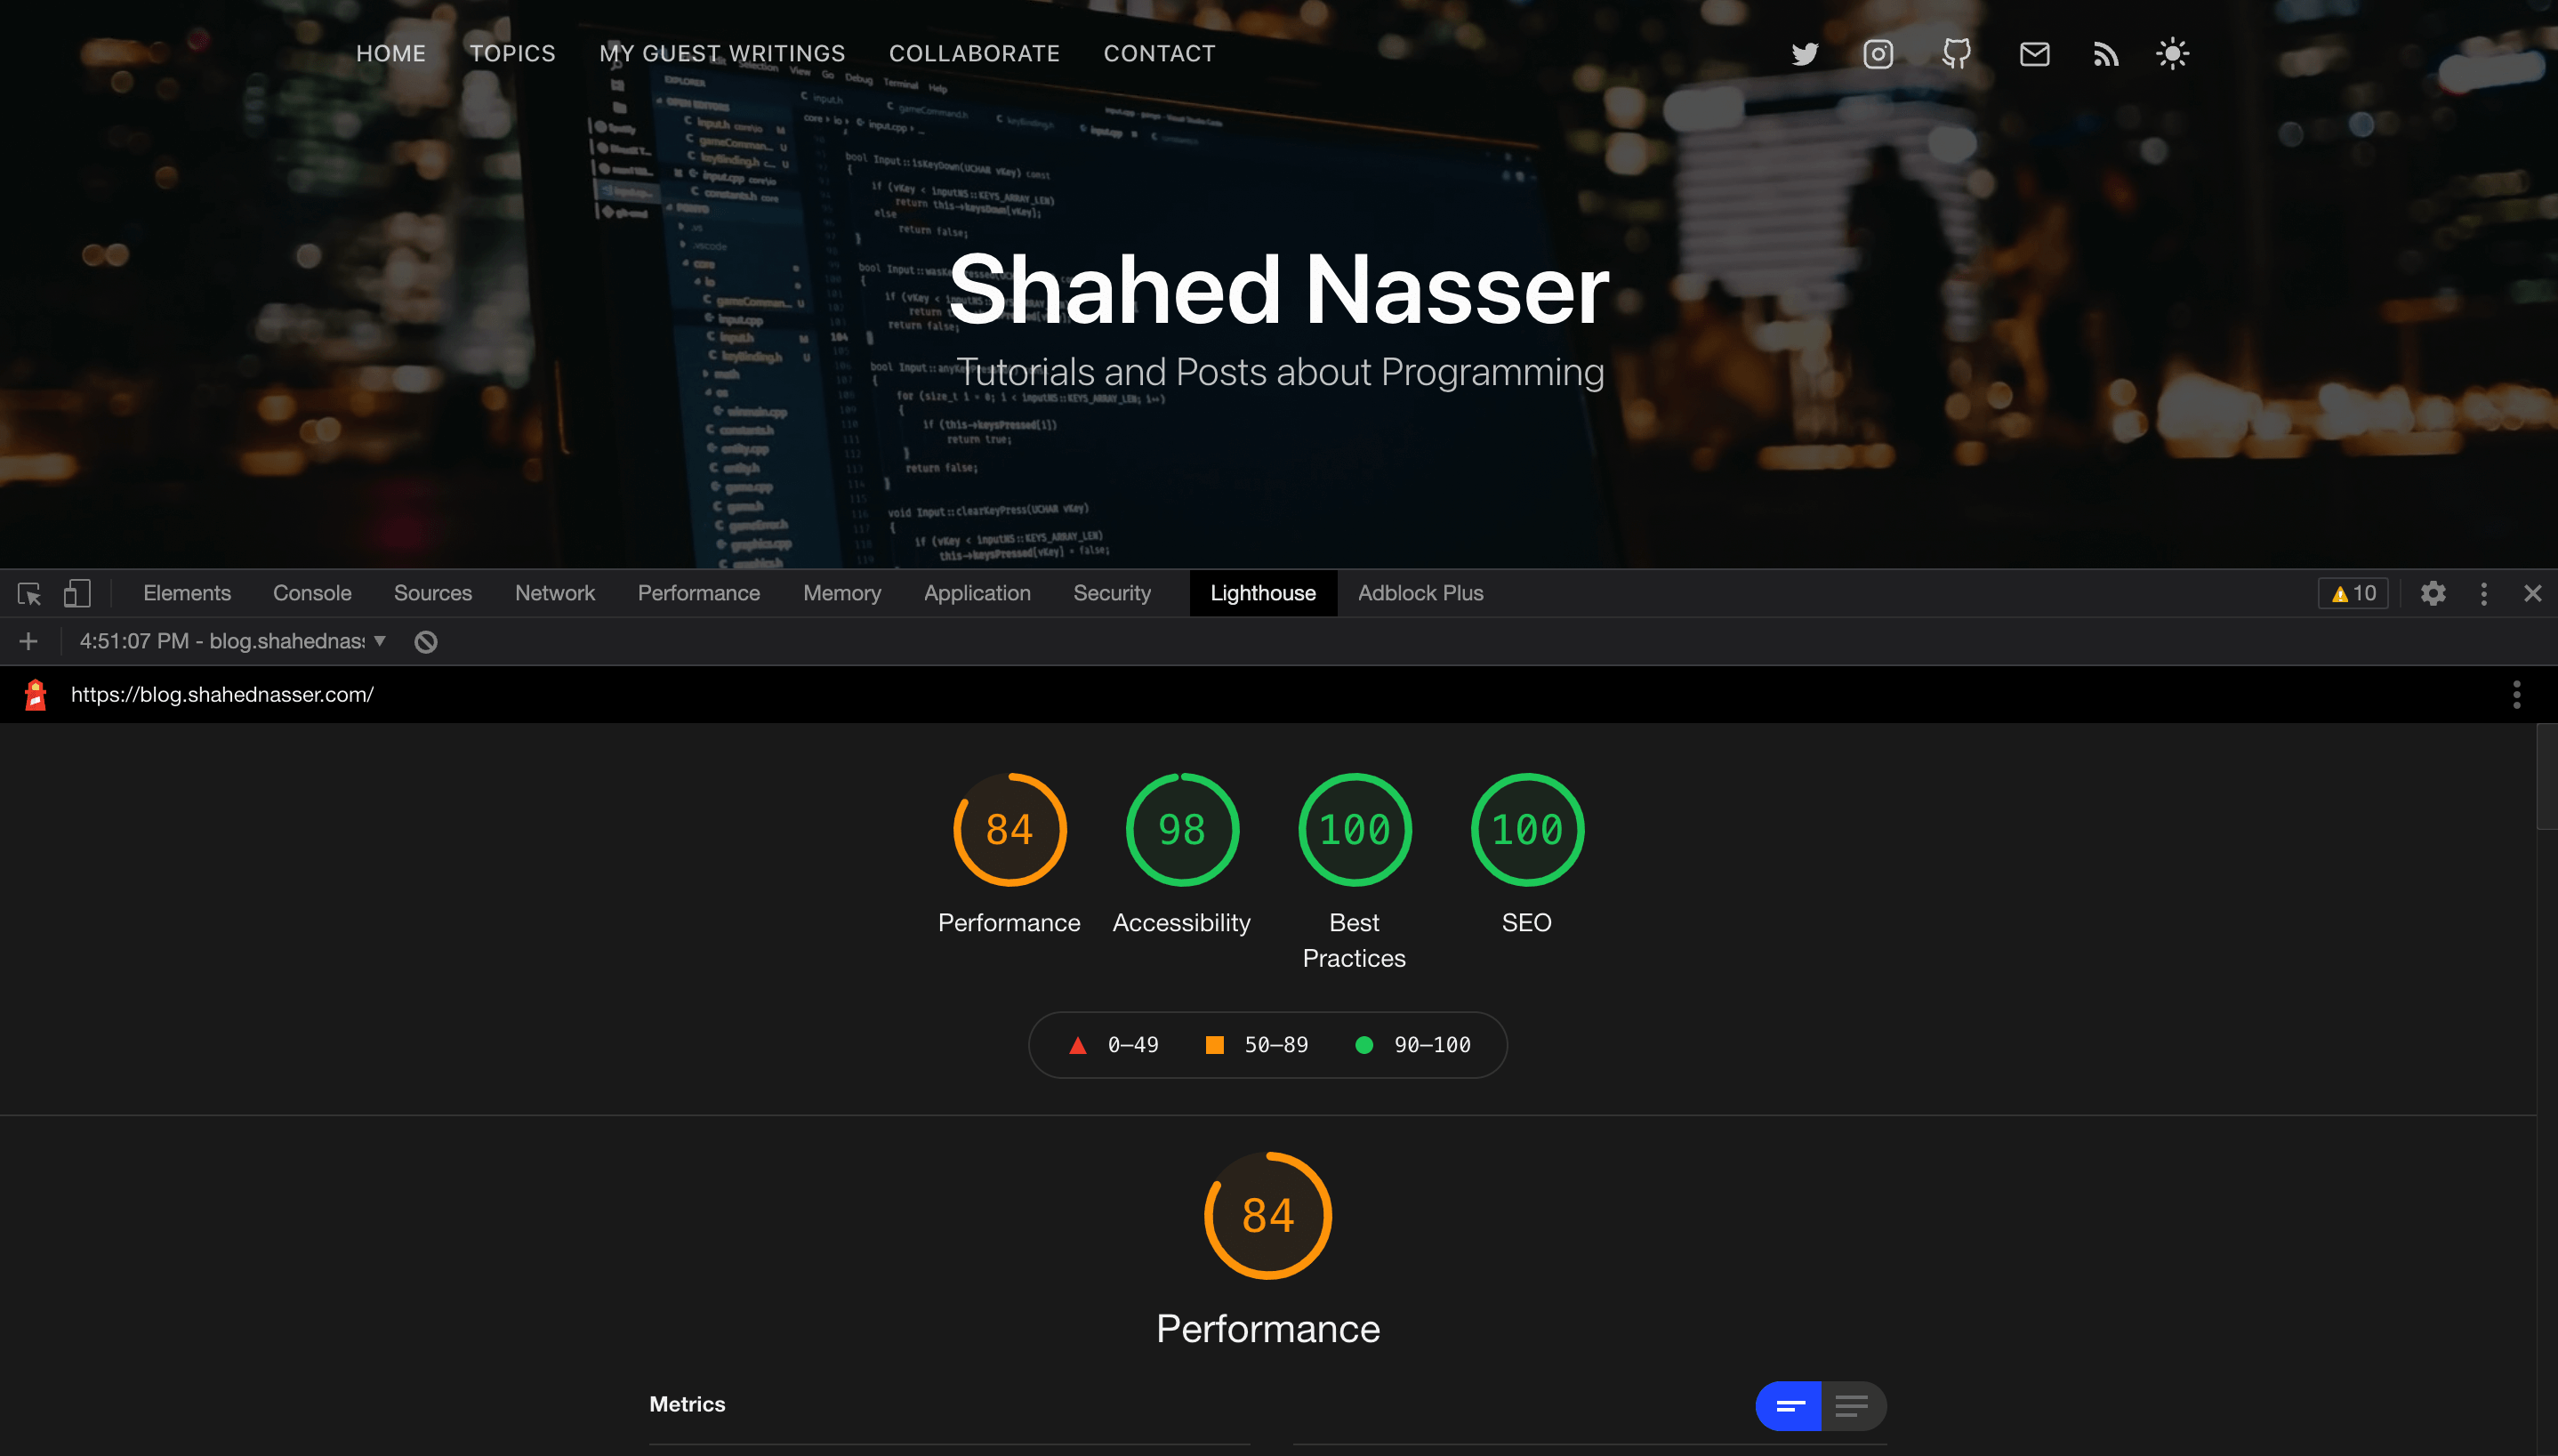
This can take a few minutes, and you’ll see that your browser’s window might grow and shrink through the process. This is because the report entails different screen sizes and conditions for your web page. Once it’s done, the Lighthouse tab will include the result for the audit, which will include the score for each of Performance, Best Practices, Accessibility, and SEO.
It should be noted that sometimes the results can be different based on your internet connection. Also, sometimes Lighthouse can show a notice that some extensions might have affected the result. If so, it’s probably best to run the test in an Incognito Window.
When Lighthouse has finished running, you can click on any of the categories to see a more detailed report.
Performance
Performance focuses on how to make your website load faster. We’ll go over the six important metrics for Performance, what they each entail and how to achieve a better score in each of them.
First Contentful Paint (FCP)
The first contentful paint (FCP) is measured from the moment the user navigates to the web page. It measures how long it takes for the first piece of DOM content to load. The DOM content can include images, non-white canvas elements, and SVG elements.
FCP is measured in seconds. In order for your web page to have a “Green” score — which means a fast FCP — the first piece of DOM content should take at most 1.8 seconds to load. Once it goes above that, it can go to either moderate or slow.
The reason FCP is important goes back to understanding the user. As mentioned before, users are impatient and will leave your website if it takes too long to load. A fast FCP keeps users engaged. It can be something as simple as a loading screen that tells the user to hang in tight because the web page is going to load soon.
One factor that can affect your website’s FCP time is fonts. Fonts can take a long time to load, sometimes making the text invisible until it loads. A good way to solve this is by using the CSS property font-display: swap; when declaring your font using @font-face. For example:
@font-face {
    font-family: 'MyFont';
    font-style: normal;
    font-weight: 400;
    src: url(MyFont.woff);
    font-display: swap;
}
If you’re using Google Fonts, this property is now enabled by default. This property allows the text to appear using the user’s system default font until the website’s font is loaded.
Another factor that affects your FCP is render-blocking resources. These are usually JavaScript or CSS files that are loaded synchronously in the <head> and take a long time to load. These resources will force the rest of the page to wait until they’re loaded before the page can fully load, thus affecting the FCP of DOM content.
Here are some ways you can resolve this:
Add the
deferorasyncattributes to your<script>tags. For example:<script src="myScript.js" defer></script>Minify the JavaScript and CSS files being used on the page, reducing its size so that loading these assets doesn’t take as long. This depends on what framework or programming language you’re using, but almost all of them have a way of doing that. You can check out simple tips on how to minify JavaScript when using various popular frameworks on the web.dev site.
Remove unused CSS in your web page. As the amount of CSS grows in size, reducing your CSS files by removing unnecessary rules and properties that aren’t being used on a page can make it load faster. Again, there are different ways to do that based on the framework you’re using. However, you can use Chrome’s developer tools to view unused CSS in the Coverage tab. Using frameworks like Tailwind CSS — which use the tree-shaking mechanism to reduce your CSS styles instead of inflating your website with many styles you’ll probably never use — can help in making your website load faster.
Reduce the server’s response time. This can be done either by performing the logic required for the page to load using asynchronous requests, caching the data the server is frequently using, or optimizing your server code to get the required result faster.
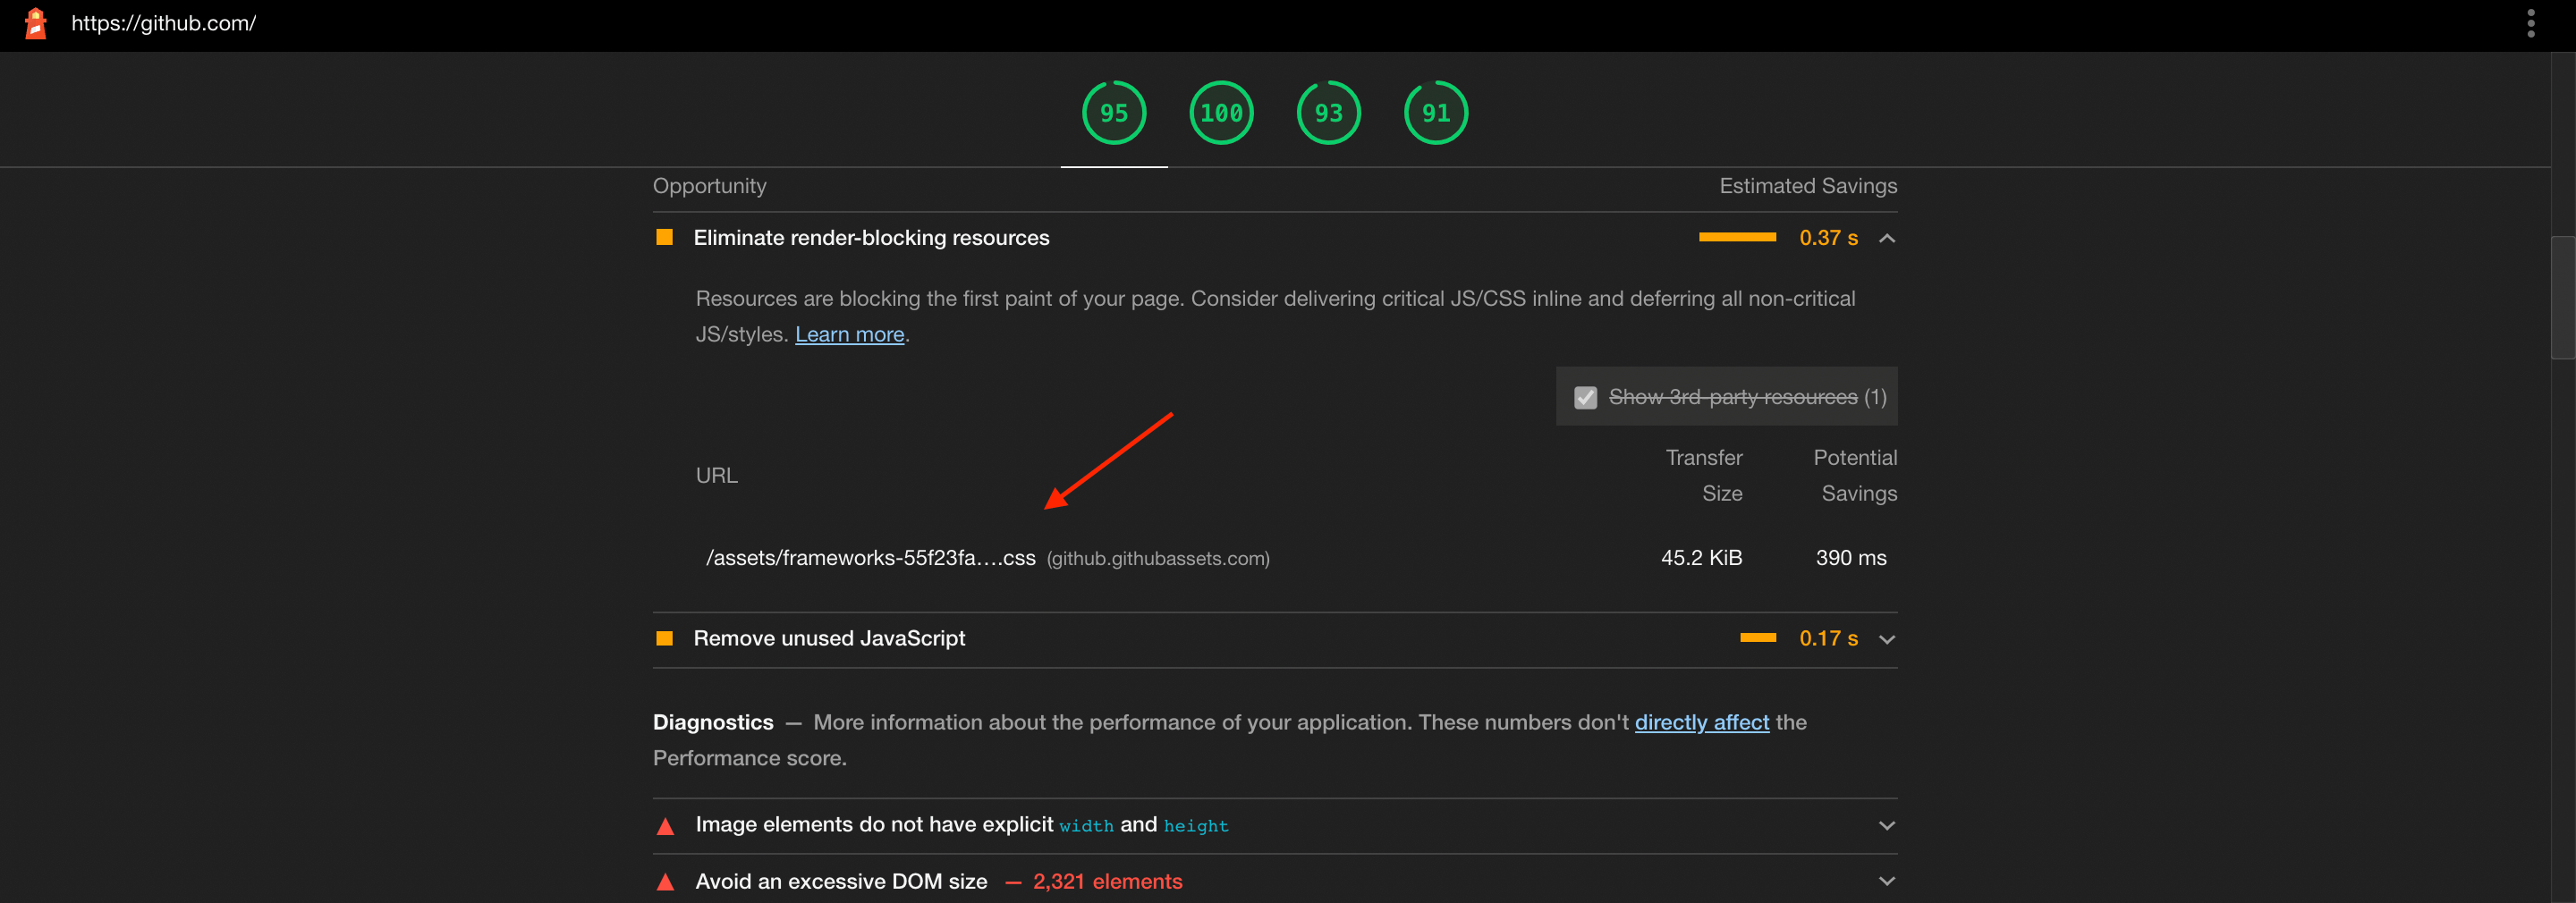
When you perform the Performance audit, if your web page has an issue with the fonts, the content-blocking resources, unused CSS, or other of the issues mentioned above, Lighthouse will highlight each file causing the issue and give tips on how it can be improved. For example, if a font is blocking the text’s visibility, Lighthouse will show you the font file that’s causing the issue and how resolving the issue will make the page’s FCP time faster.
Here’s an example from the GitHub audit report that shows a CSS file as a “render-blocking resource”.
As you read the rest of the metrics, you’ll realize that they somehow depend on the result of this one. So, it’s important to have a good score in FCP.
Time to Interactive (TTI)
Time to interactive (TTI) measures how long it takes for your user to be able to fully interact with the web page. The result of TTI depends on FCP, as the faster the FCP, the faster the user can interact with the web page.
Users not only need to see the page loaded, but they also need to be able to interact with it. It even becomes more annoying if the website seems fully loaded but the user can’t interact with it properly. For example, clicking a button doesn’t do anything, even though it looks ready to use on screen. Improving your website’s TTI will make it easier for your users to use your website, which can result in a better conversion rate.
In order for a web page to be considered fully active, it first needs to achieve FCP. Then, event handlers should be registered for those elements on the page that are visible. And finally, the page should be able to respond to a user’s interactions within 50ms.
A web page’s TTI is measured in seconds. For a web page to have a good TTI, it should take at most 3.8 seconds to become fully interactive. If the page takes longer than that, it will either be considered moderate or slow.
There are several factors that affect a web page’s TTI score. The most common are “main thread work” and “JavaScript execution time”.
Main thread work means the process it takes for the browser to render a page. For the browser to render a page, it first parses the HTML, then builds the DOM, parses the CSS, and executes the JavaScript. If this process takes too long, it means it will also take long for the page to be ready to respond to the user’s interactions, as processing events is also a part of the main thread work.
JavaScript execution time includes the time it takes to fetch the script, parse it, compile it, execute it, and the memory it might use. If fetching the script takes a long time due to its size, it will take a longer time to be able to parse and execute it. After the script is fetched, parsing and compiling it occurs in the main thread work, so if it takes a long time, it will slow down the main thread work. If the script has a lot of code to be executed on page load, which occurs on the main thread work, it will take a long time for the web page to be ready for the user’s interaction.
Improving the TTI metric is very similar to FCP, as it relies on it first and foremost. Good practices would be to minify JavaScript and CSS files and remove any unused code in them. An additional thing you can do is to split the JavaScript and CSS files into bundles (typically done with a bundler, such as webpack). This means that the web page can fetch the bundles faster, and if you’re also using the defer attribute, as detailed in the previous section, it will fetch the bundles even faster asynchronously.
Total Blocking Time (TBT)
This one is pretty similar in concept to TTI. Total blocking time (TBT) measures the total time between FCP and TTI, during which various tasks block user interaction. If an individual task takes longer than 50ms, then it’s considered blocking, and the time after that point is added to the total blocking time. For example, if a particular task takes 90ms, 40ms (that is, 90ms – 50ms) is added to the TBT overall measurement .
This metric basically emphasizes what TTI measures, with extra focus on which tasks are affecting the load time of your page, and how much are they affecting it.
TBT is measured in milliseconds. To get a good TBT score, the total blocking time of tasks on your web page should not be more than 200ms.
To improve your TBT score, it’s similar to TTI. You need to minimize main thread work and reduce JavaScript execution. However, as TBT looks more into the details of the code execution, additional enhancements could be optimizing your JavaScript code so that it works faster. For example, when selecting an element from the document, be specific in your selector rather than using a generic selector like div. Take a deeper look into your code, and look for any chance to improve your code, which will in turn optimize the time each task takes.
Largest Contentful Paint (LCP)
Largest contentful paint (LCP) measures how long it takes for the largest element in the visible viewport to load. The elements that are taken into consideration are <img>, <image>, <video>, elements that have a background image, or block elements that have text and inline nodes as their children.
An element is considered as the largest element if it’s the largest in the current viewport. This doesn’t include any parts of the elements that aren’t shown in the current viewport (for example, if an image extends outside the visible viewport, only the visible part will count), or margin, padding or borders added with CSS.
As the largest element in the viewport can change as the page is loading, the LCP will be measured for every new element entry in the website until the user is able to interact with the page. So if, on page load, the largest element is a node that has text in it, but then an image loads that’s larger than the text node, LCP will be measured for the image instead. Once the user can interact with the page — which is measured with TTI as mentioned earlier — the LCP will stop measuring any new entries.
LCP is measured in seconds. A good LCP is when the largest content takes at most 2.5 seconds to load.
Similar to FCP, LCP is affected by render-blocking resources. It’s also affected by the time it takes to load resources (for example, images, CSS files, and so on). Another factor that affects your LCP score is the time it takes for the server to respond.
To improve LCP, it’s similar to previous methods discussed. Doing things like deferring render-blocking resources, minimizing CSS/JavaScript files, and using the font-display: swap property can optimize your LCP score.
Additionally, you can do the following to improve your web page’s LCP score:
Use a CDN for your assets like images and videos. CDNs serve assets faster, so it can improve on the “server response time” for these assets.
Compress the images to a smaller size. This can be done by many online tools like Compress PNG. Making the image smaller reduces the time it needs to be loaded.
Convert your images to WebP, as they’re smaller than PNG and JPEG images. This also can be done using online tools.
Correctly size the image based on the device’s size.
To do that last task, you can use the <picture> element to include the image based on the width of the device. For example:
<picture>
  <source srcset="img-small.png" media="(max-width: 567px)" />
  <source srcset="img-medium.png" media="(max-width: 992px)">
  <img src="img.png" />
</picture>
Notice that, in order to specify the media size, we use the <source> tag and specify the media attribute. However, to make sure our web page supports all browsers and user agents, we add the <img> tag as a fallback in case <source> is not supported by the browser.
As it’s not ideal to always resize and convert images, a great option that will do that for you on the fly is Cloudinary. Cloudinary optimizes your images by resizing and converting them as necessary, and they offer a pretty good free plan.
Another option for automating this process is using tools like Gulp or webpack.
For example, the image below shows the report run on my website that includes a warning about image sizes.

Speed Index
As you can probably guess from the name, the speed index metric measures the speed at which the content of the page becomes visible. It’s done by capturing a video of the page loading, then computing the visual progression between frames.
This metric, similar to the rest, is measured in seconds. To have a good speed index score, your page should load its content within 3.4 seconds from the time it starts loading.
This metric relies a lot on previous metrics mentioned. Your web page’s speed index will drop if it has any of the aforementioned issues — such as when the images aren’t compressed, styles and scripts aren’t minified and optimized, or a lot of work is happening on the main thread. These issues will delay the visibility of the content of the page. To improve your speed index, work on improving the same issues that have been discussed already.
Cumulative Layout Shift (CLS)
Cumulative layout shift (CLS) measures the number of times the layout of a page changes before it’s fully loaded. For example, how many times, as the page is loading, does a user try to click on a button, only for the content to move and result in the user clicking somewhere else? It can be very annoying, and sometimes can cause users to perform actions that they didn’t actually intend.
Each layout change is called a layout shift. CLS measures the multiple layout shifts that occur within a second. So, if your web page has a lot of layout changes, it will have a bad CLS score. The lower the CLS score the better. A web page’s CLS score should be 0.1 or below to be considered fast.
Here are some tips to avoid layout shifts, thus lowering and improving the CLS score of the page:
Set the
heightandwidthattributes of an image or video, so that even if it takes a long time to load, it won’t move content around it once it’s loaded. When these attributes are set, the space of that height and width will still be held for the asset as it loads, and the content around it won’t be affected when it loads.Avoid using popups or any overlaying elements unless they appear when the user interacts with the page — for example, when the user clicks a button.
When it’s necessary to move elements, use transform animations, which indicate to the user that a layout change is about to happen rather than catch them off guard.
The Impact Performance Metrics Have On The Search Console
Google’s Search Console is a great tool for understanding how your website is performing in the search engine. You can see a lot of information about your site’s SEO, including which queries your website rank higher for, which pages the users find through performing search queries, and how high the rankings of your web pages are.
If you have an account on Google’s Search Console and have your website added to it, you’ll notice that, in the sidebar, there’s “Core Web Vitals”.
Web Vitals was created by Google to simplify the process of improving your website’s user experience and make it unified. Core Web Vitals is a subset of the Web Vitals. They’re the most important metrics as they apply to all websites, and the results will be present in all Google Tools. At the time of writing this article, Core Web Vitals consists of FCP, LCP and CLS. However, the list is expected to expand, as the research for improving user experience and performance is ongoing.
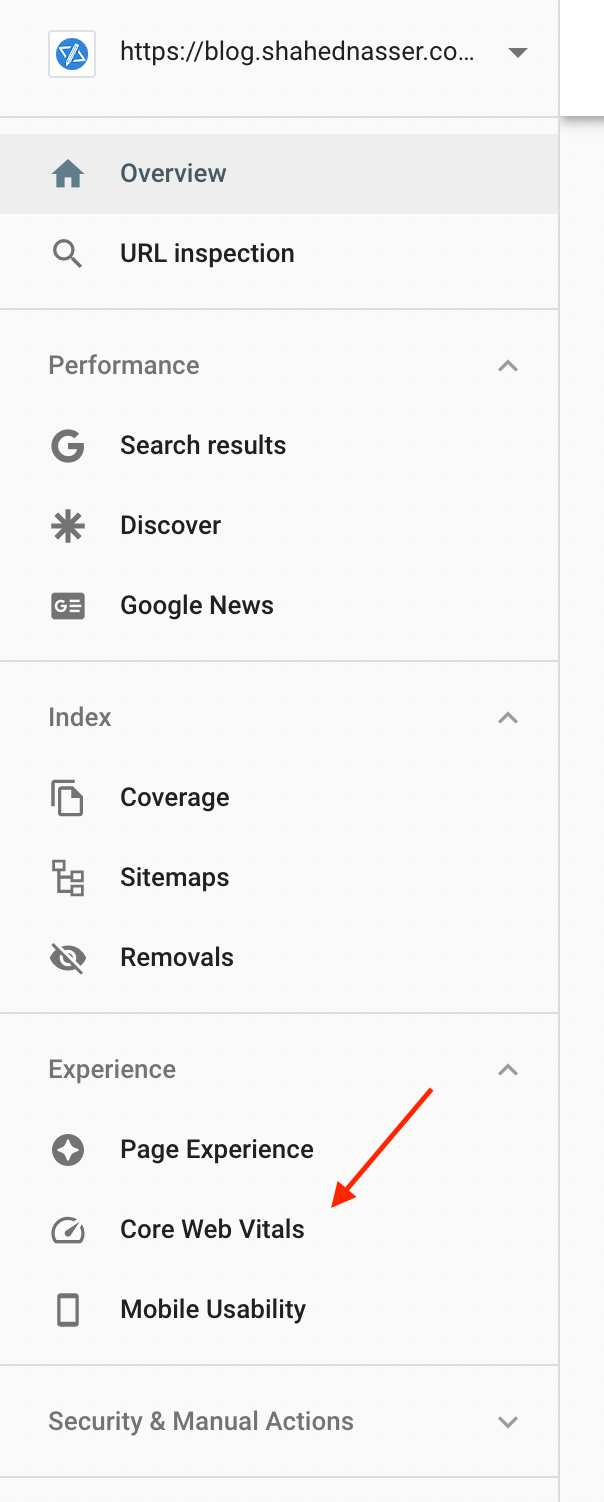
This page shows how the important metrics from the Performance audit measure up when used by users that find your website through the search engine, and if web pages have low metrics, it will show them as poor URLs or URLs that need improvements.
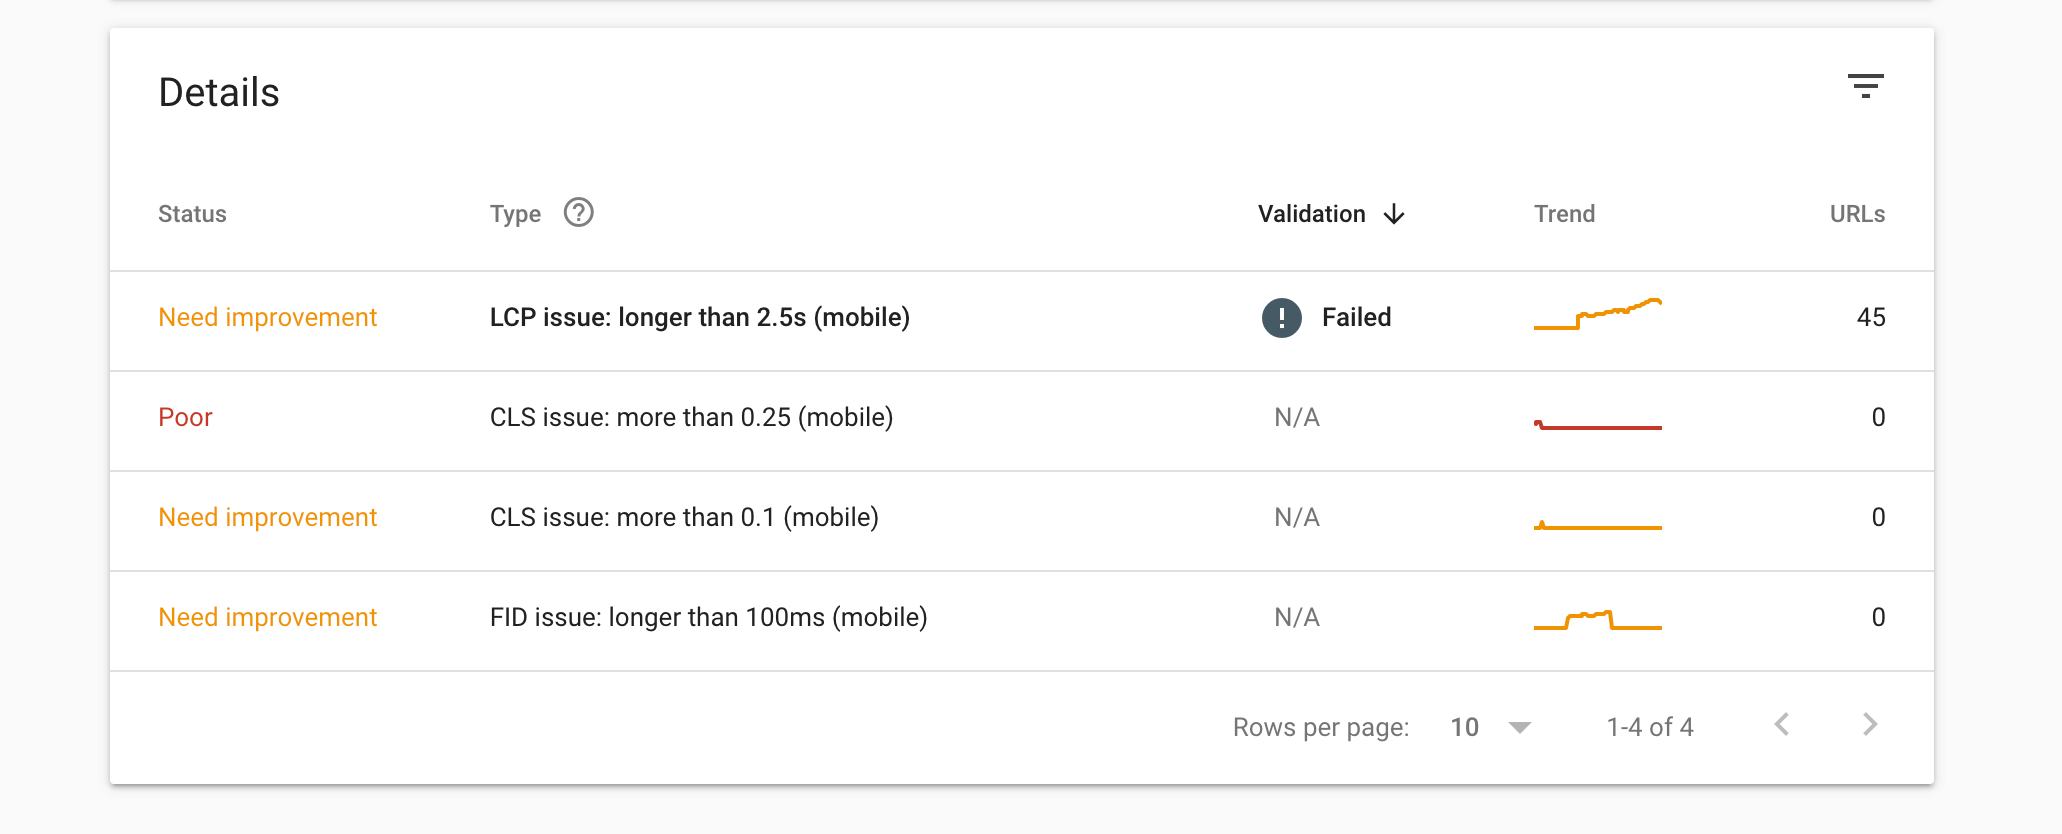
The core vital metrics are FCP, LCP and CLS. If your website or web page has a low score in these metrics, warnings of different levels will show in your site’s Core Web Vitals report. The image below shows an example of how LCP, CLS, and other issue will show up in Google’s Search Console.
According to Google, a website’s Page Experience report, which takes into account mobile usability issues and the core vital metrics, is used as a “ranking” signal for the URL. This means that, if a web page has a low core vital metric, it can rank lower in the results. For this reason, it’s important to have a good score in these three metrics.
Accessibility
The next audit that Lighthouse performs is Accessibility. Accessibility ensures that your users can access your website through different devices, hardware, or tools. It also ensures that users with disabilities are able to access your website the same way every other user can. Accessibility allows users in different use cases to access your website without affecting their experience.
Here are some tips to ensure a good accessibility score:
Ensure that your website includes Accessible Rich Internet Applications (ARIA) attributes. This includes using attributes like
aria-checked,aria-labelledby,aria-describedbyand more. You can learn more about ARIA and how to use the attributes in your website in the tutorial “Improve Your Website’s Accessibility With WAI-ARIA”.When using ARIA attributes, make sure you’re using them correctly. For example,
aria-disabled— which indicates whether an input is disabled — shouldn’t be used with elements like<div>.Make sure the IDs of elements are unique.
Don’t use
aria-hiddenon the<body>element.Make sure the document has a
titleelement.
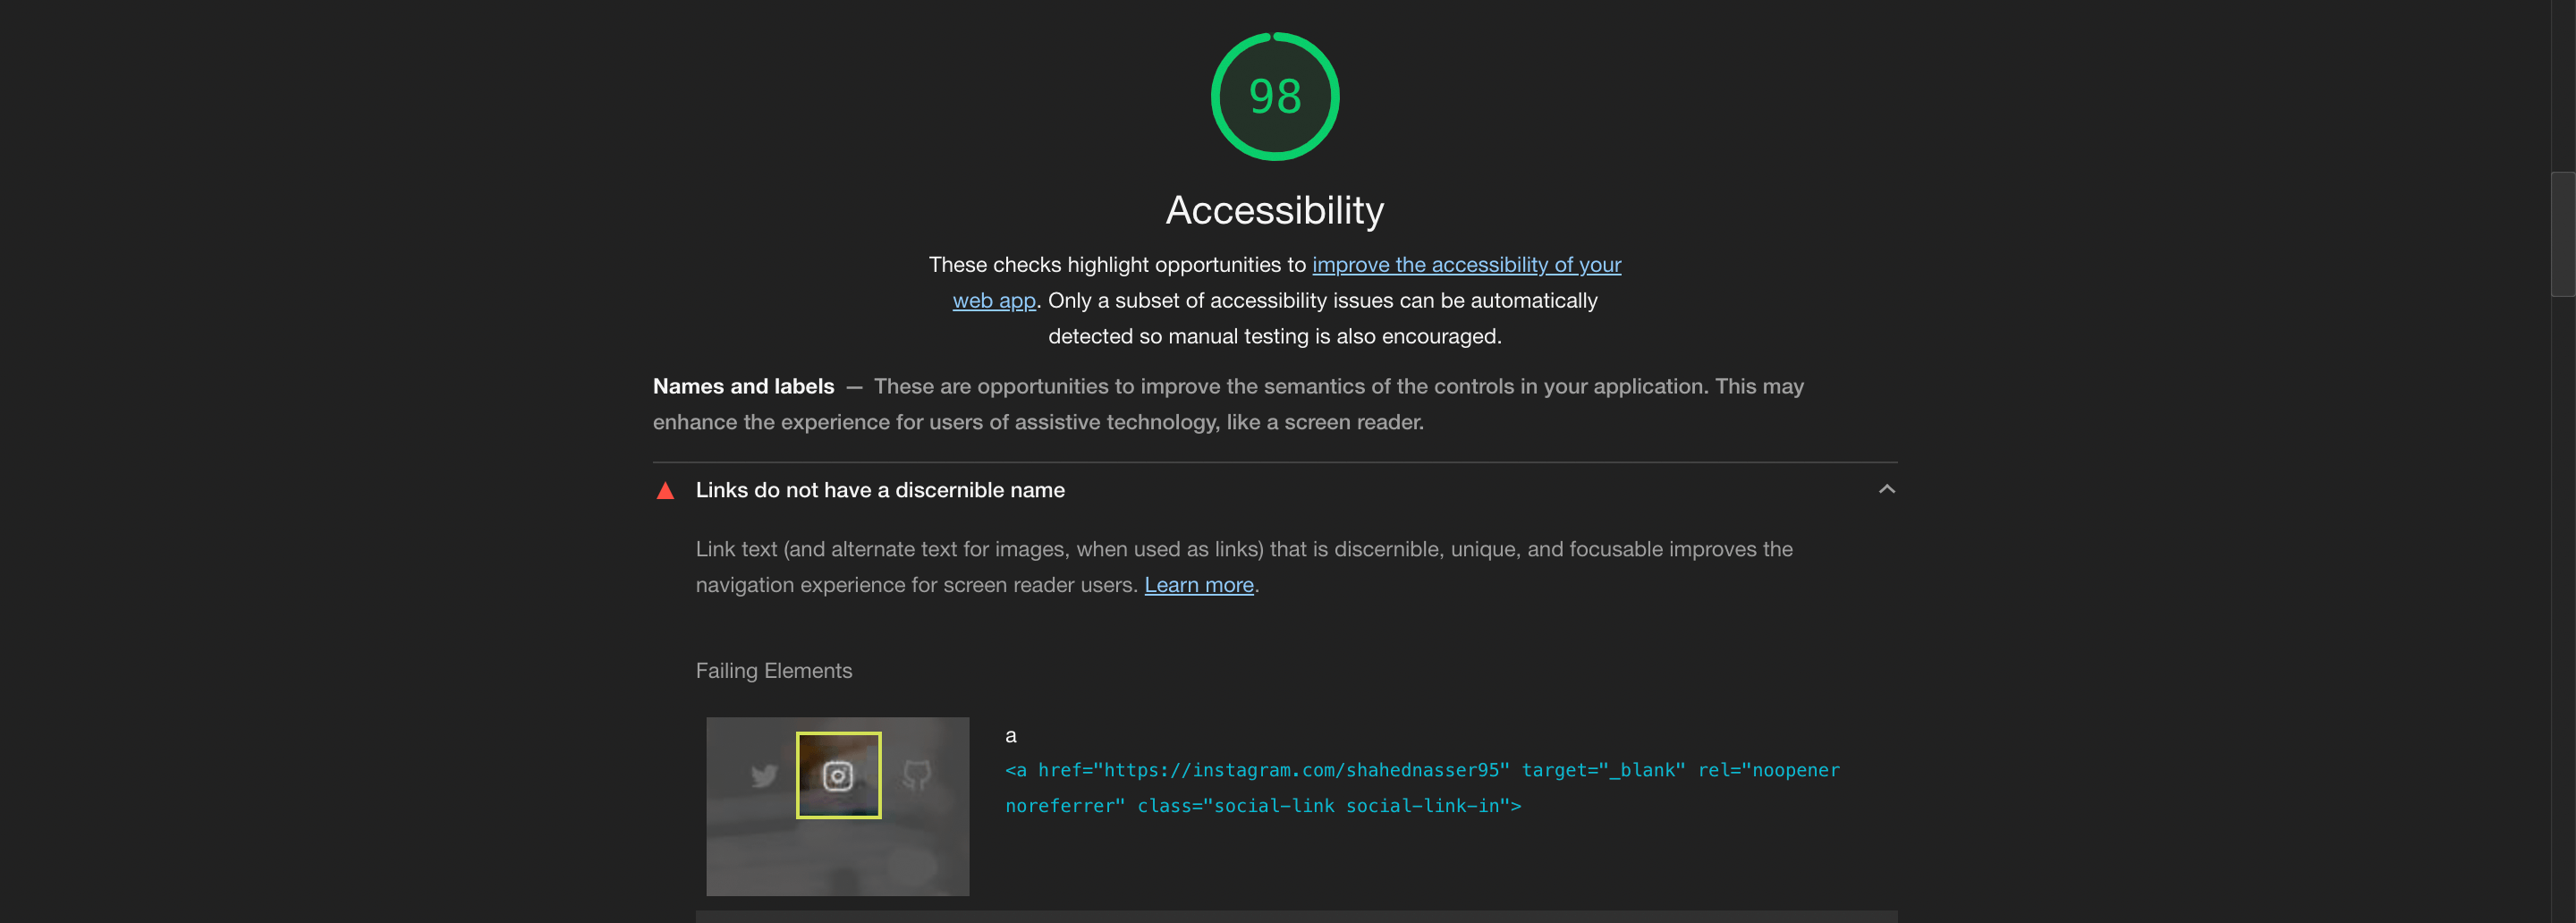
There are many details that go into the Accessibility audit. When you perform the audit, if there are any issues, Lighthouse will highlight them for you, which elements these issues are found at, and possible fixes for them.
Best Practices
The Best Practices audit makes sure your web page follows the guidelines that makes a website good to use for a user. These ensure that when your user uses the website, they won’t be vulnerable to any security issues or errors that might lead to a bad experience.
Here are some tips for ensuring a good Best Practices score:
Make sure no errors are logged in the browser’s console. This means that if any page on your website has errors in it — be it links not loading or errors in your code — you should fix them so that they don’t happen anymore.
Ensure that, at the top of your HTML document, you have
<!DOCTYPE html>.Protect your website with HTTPS. Even if your site doesn’t handle sensitive data, it’s generally a good practice to make sure your website is secure for all users.
Make sure your images are rendered in the correct aspect ratio. For example, a square image shouldn’t be rendered in a rectangular aspect ratio.
These are just some of the best-practice tips that will improve your Best Practices score. When you run the test on your web page, you’ll see if there are any issues to be addressed.

SEO
The SEO audit measures all the different practices and guidelines to make sure your page ranks well in search engines. Improving the score of this audit is a good start to improving your website’s SEO.
Here are some tips to improve your web page’s SEO score:
Ensure that your web page has the
<title>element, as well as goodmetadescription in the<head>of the web page.Make sure your web page’s font sizes are readable on different screen sizes. Don’t make them too small!
Instead of using links with the text “here” or “read more”, use a descriptive text that actually allows the user to understand where they’re going. For example, if your link leads to your Instagram account, the text should be “support my Instagram account”.
Ensure that your site includes a
robots.txtfile, as search engines use it to crawl your website. You can learn more about how to create a goodrobots.txtfile in Google’s Create a robots.txt file tutorial.
If there are any problems in your SEO, your audit report will show you what they are and how you can solve them.
It should be noted that the results Lighthouse provides are not generally enough to make sure that your SEO strategies are all working accordingly. But it’s still a good place to start.
Using the CLI
Another way you can check a web page’s score is by using Lighthouse’s CLI tool. The CLI tool allows you to use more options to make the report more accurate.
Before you install the CLI tool, make sure you have Chrome installed. Also, you need to have Node.js installed, and it must be version 12 or above.
To check your Node.js version, run the following command:
node -v
If it’s all good, you can now install the CLI tool for Lighthouse with the following command:
npm install -g lighthouse
Once it’s installed, you can run Lighthouse’s analysis using the following command:
lighthouse <PAGE_URL>
Here, <PAGE_URL> is the URL of the page you want to generate a report for. Once you run this command, you’ll notice that Chrome will open several times, using different window sizes as well. You can also see, in the terminal, a detailed analysis of each test being performed.
Once the audit is done, an HTML file with the result will be saved in the current directory you ran the command from. If you open it in any browser, you’ll see results similar to the ones we get using Lighthouse in Chrome.
Options
Here are some of the helpful options you can add:
By default, the CLI tool will perform the audits on mobile devices of width 360px and height 640px and a device scale factor of two. To disable all these default values — that is, to perform the audits on a devices matching your desktop screen’s width and height, you can add the option
--screenEmulation.disabled. To just change the width and height of the emulation instead, you can use the options--screenEmulation.widthand--screenEmulation.height.To open the report for viewing, right after the test is done, add the option
--view.You can specify port with
--portand hostname with--hostname.To specify the categories you want to run, use the option
--only-categories— for example,--only-categories=performance,seo.To specify the audits you want to run, use the option
--only-audits. To exclude some audits, use the option--skip-audits.To specify the output type, use
--output. Values can be “json”, “html”, and “csv” — for example,--output=json,html.To add headers to the request performed, use
--extra-headers, where the value is a string — for example,--extra-headers "{\"Accept\":\"application/json\"}".To block requests in the page to certain URLs, use
--blocked-url-patterns.
There are further options and configurations for you to check out if you wish.
Using WebPageTest
WebPageTest allows for more advanced and detailed results compared to using Chrome or the CLI. Although it’s not created by Google, it still provides a deep analysis of your website’s performance in different scenarios, such as using a specific device to access your website or using slower internet connections.
To perform a test and generate a report, open WebPageTest and enter the URL you want to test into the text field.
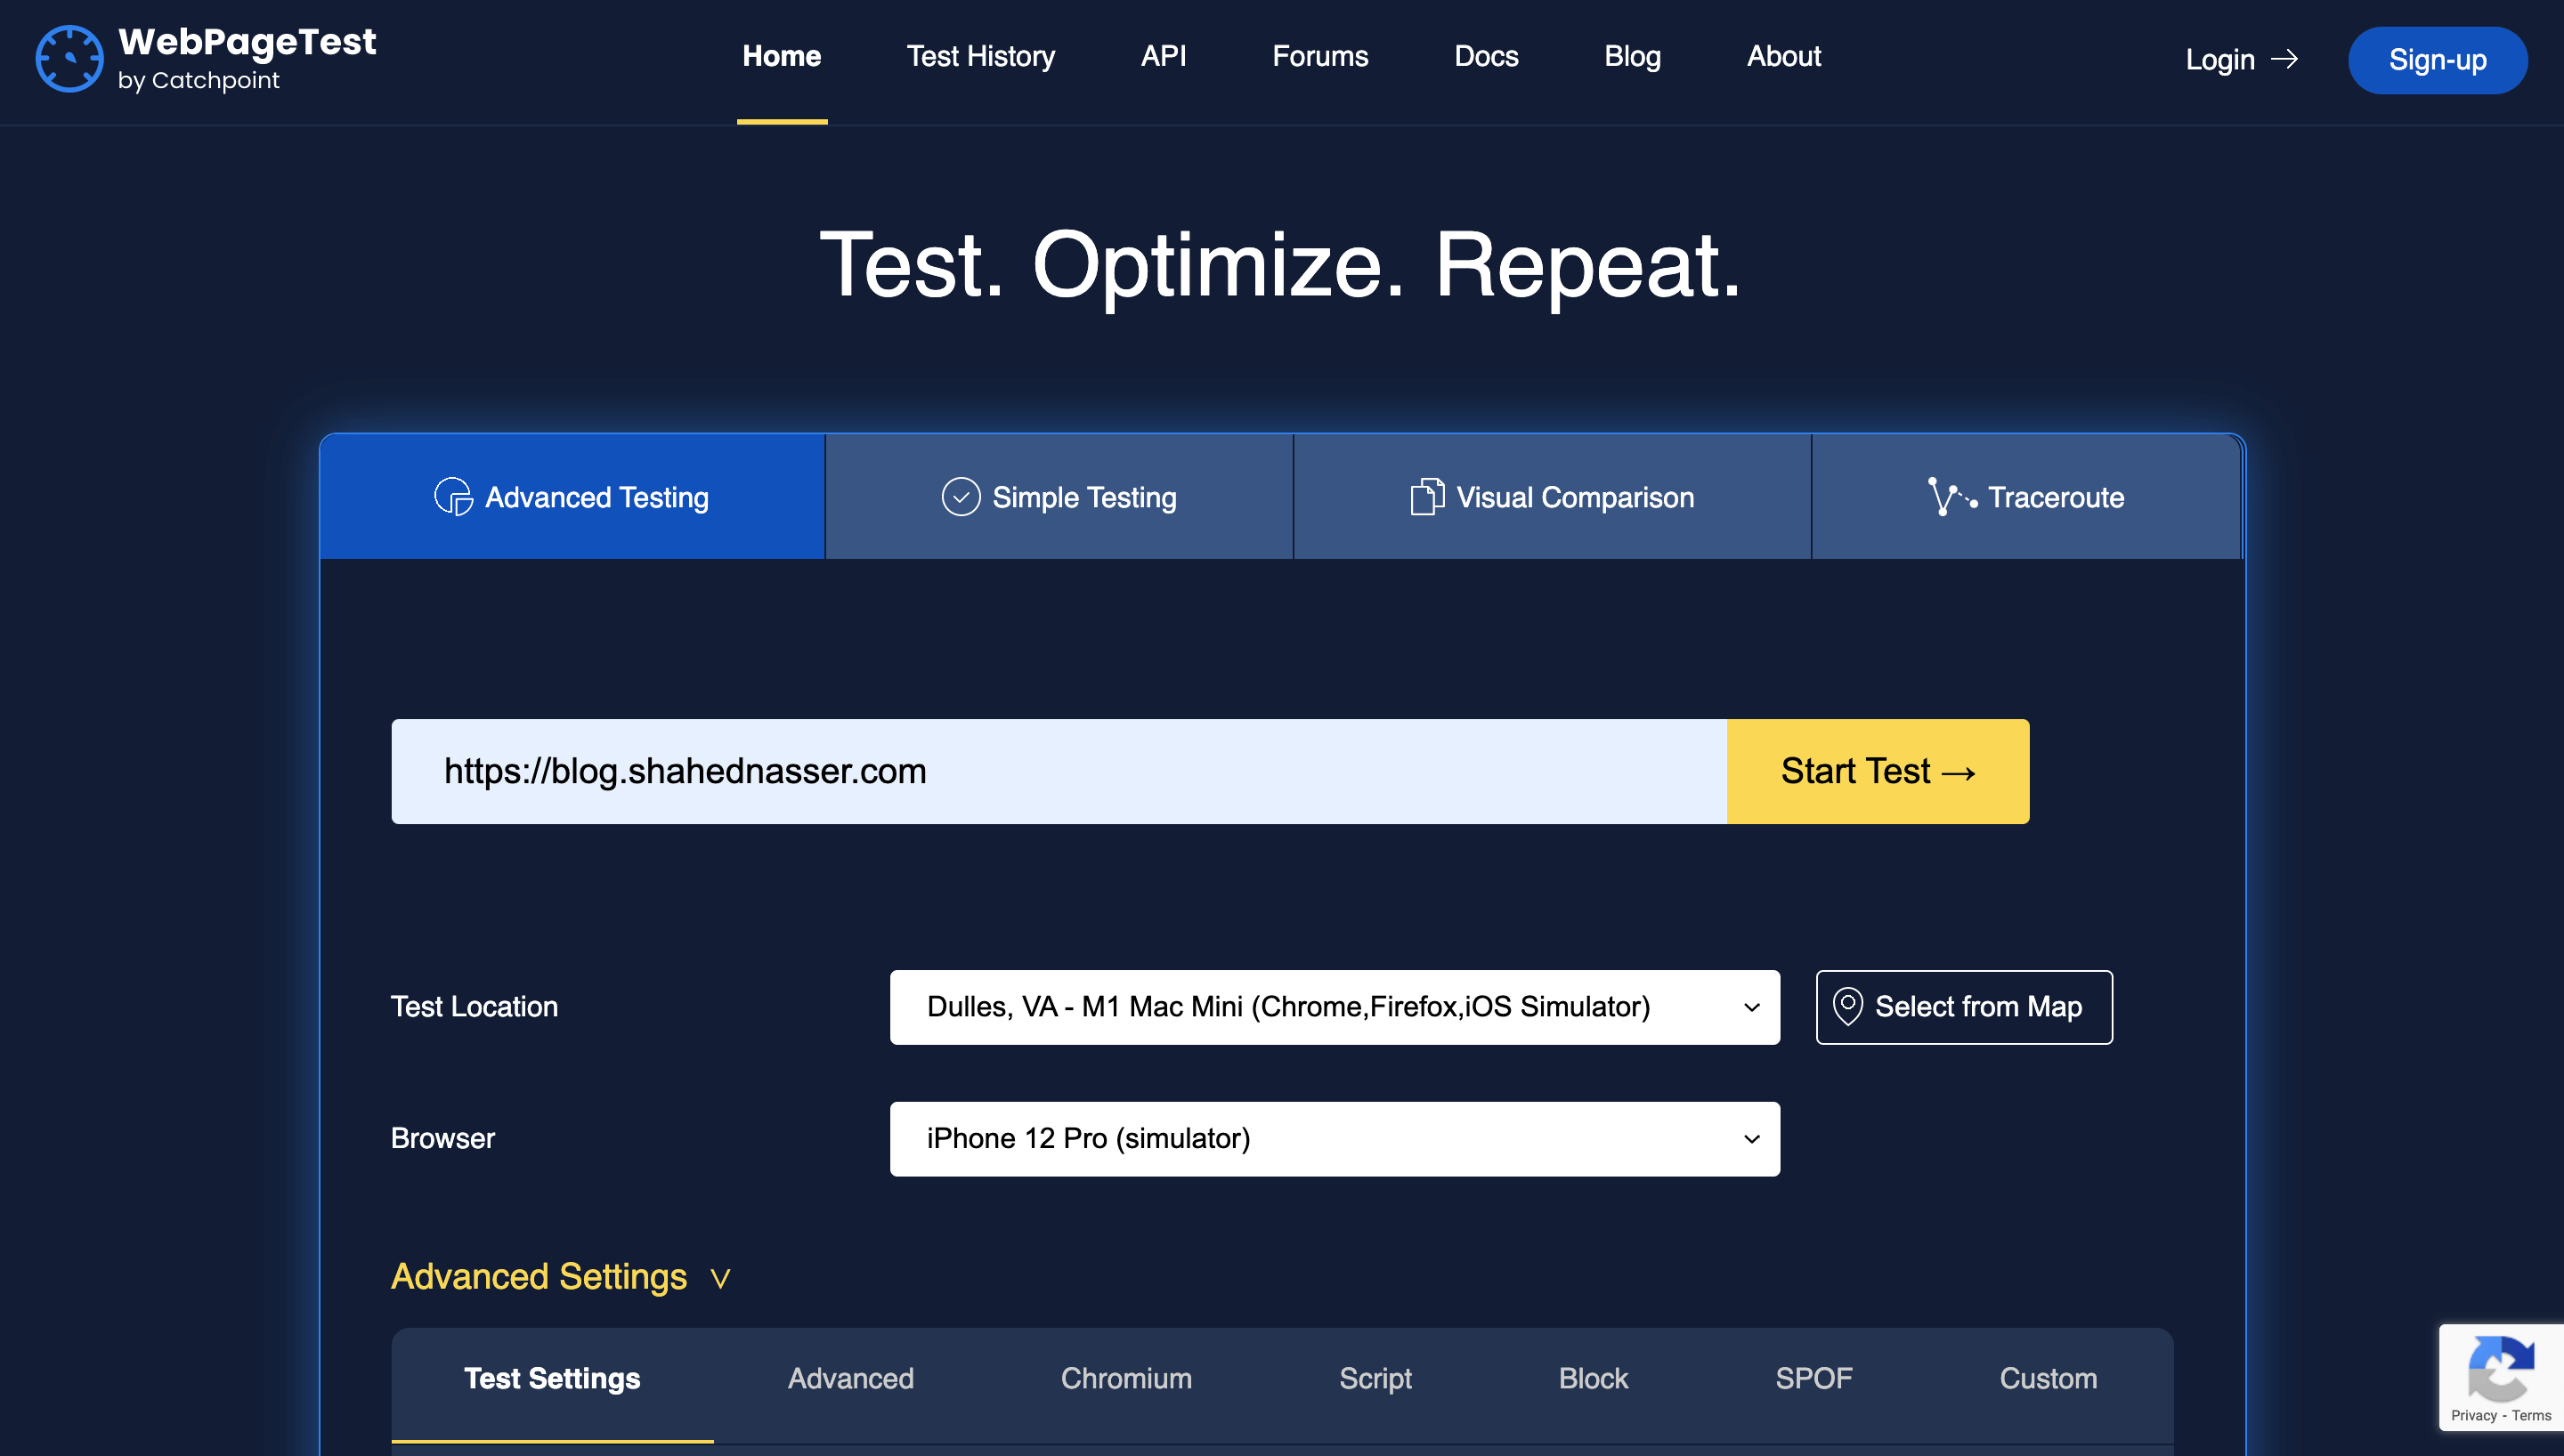
You can also specify the test location, as different test locations provide different devices you can test on.
Additionally, you can specify advanced settings if you scroll down below. In these settings, you can select different internet connections. This is extremely helpful, as it helps you understand how your website performs based on different users, such as those who have fast and slow internet connections. You can also specify the screen dimensions, and capture videos of the test as well.
There are many other settings that allow you to test your site under different conditions. You can go through the different settings by switching between the tabs.
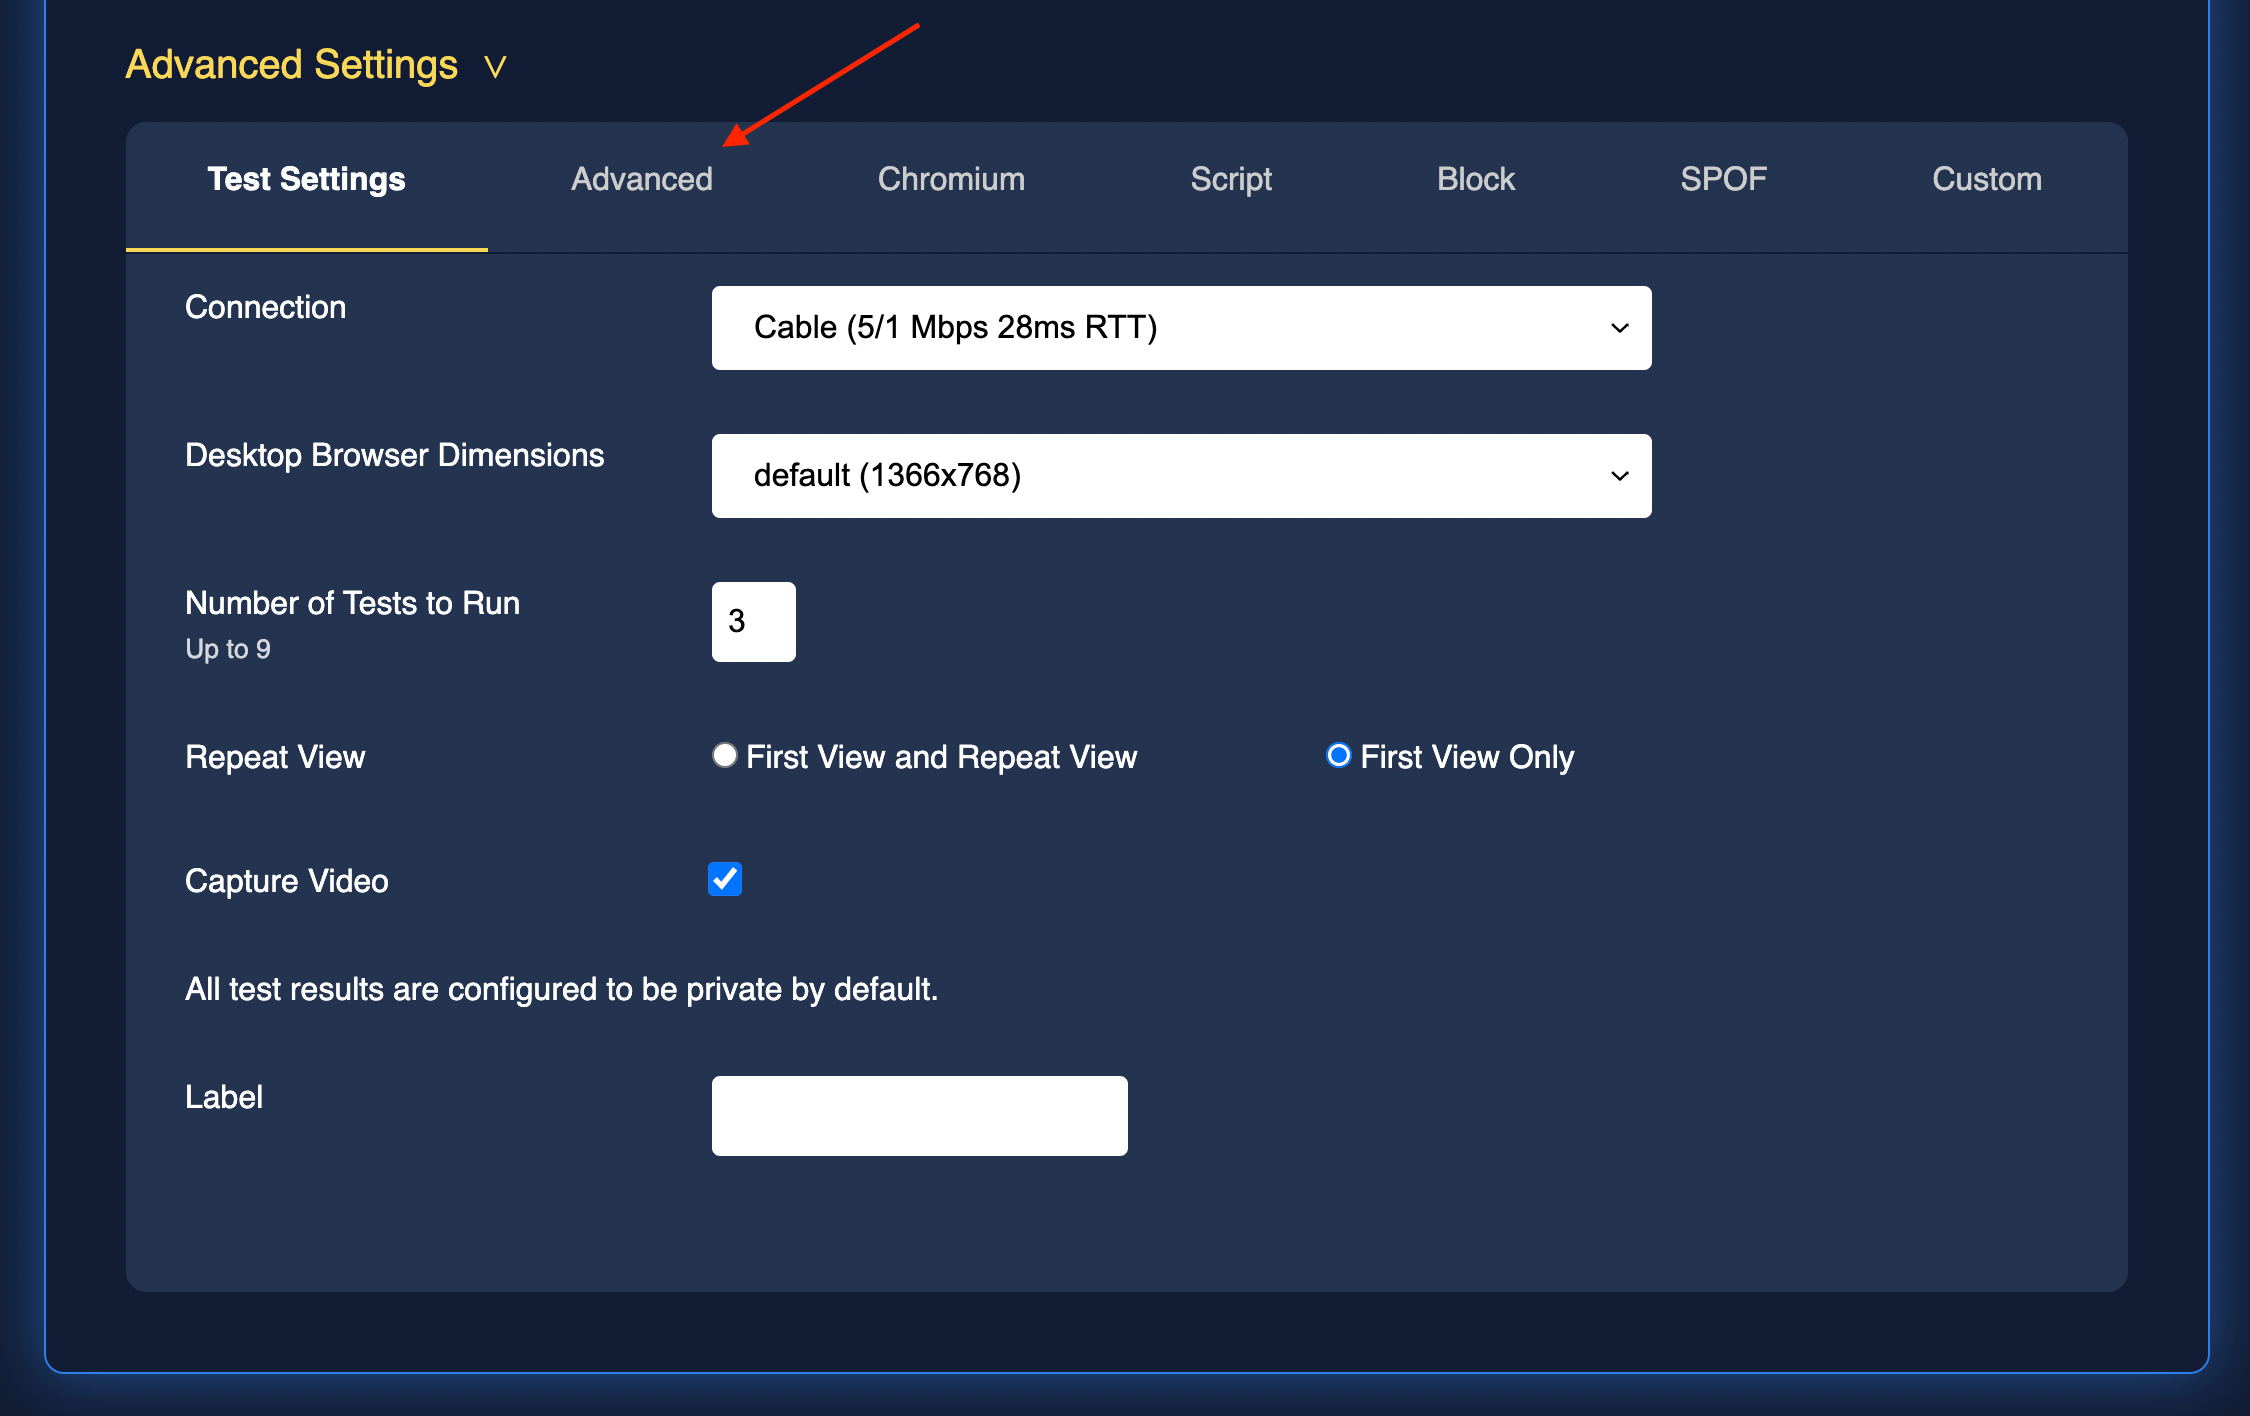
Once you’re done, click Start Test. The test might take longer than other methods, as it provides more details than the tests we’ve done previously. Once it’s done, you’ll first see the general results of the metrics we specified earlier, including FCP, TBT, speed index and more. You can also see screenshots of each of the runs performed (by default, three runs are performed, but you can change that in the advanced settings in the previous form).
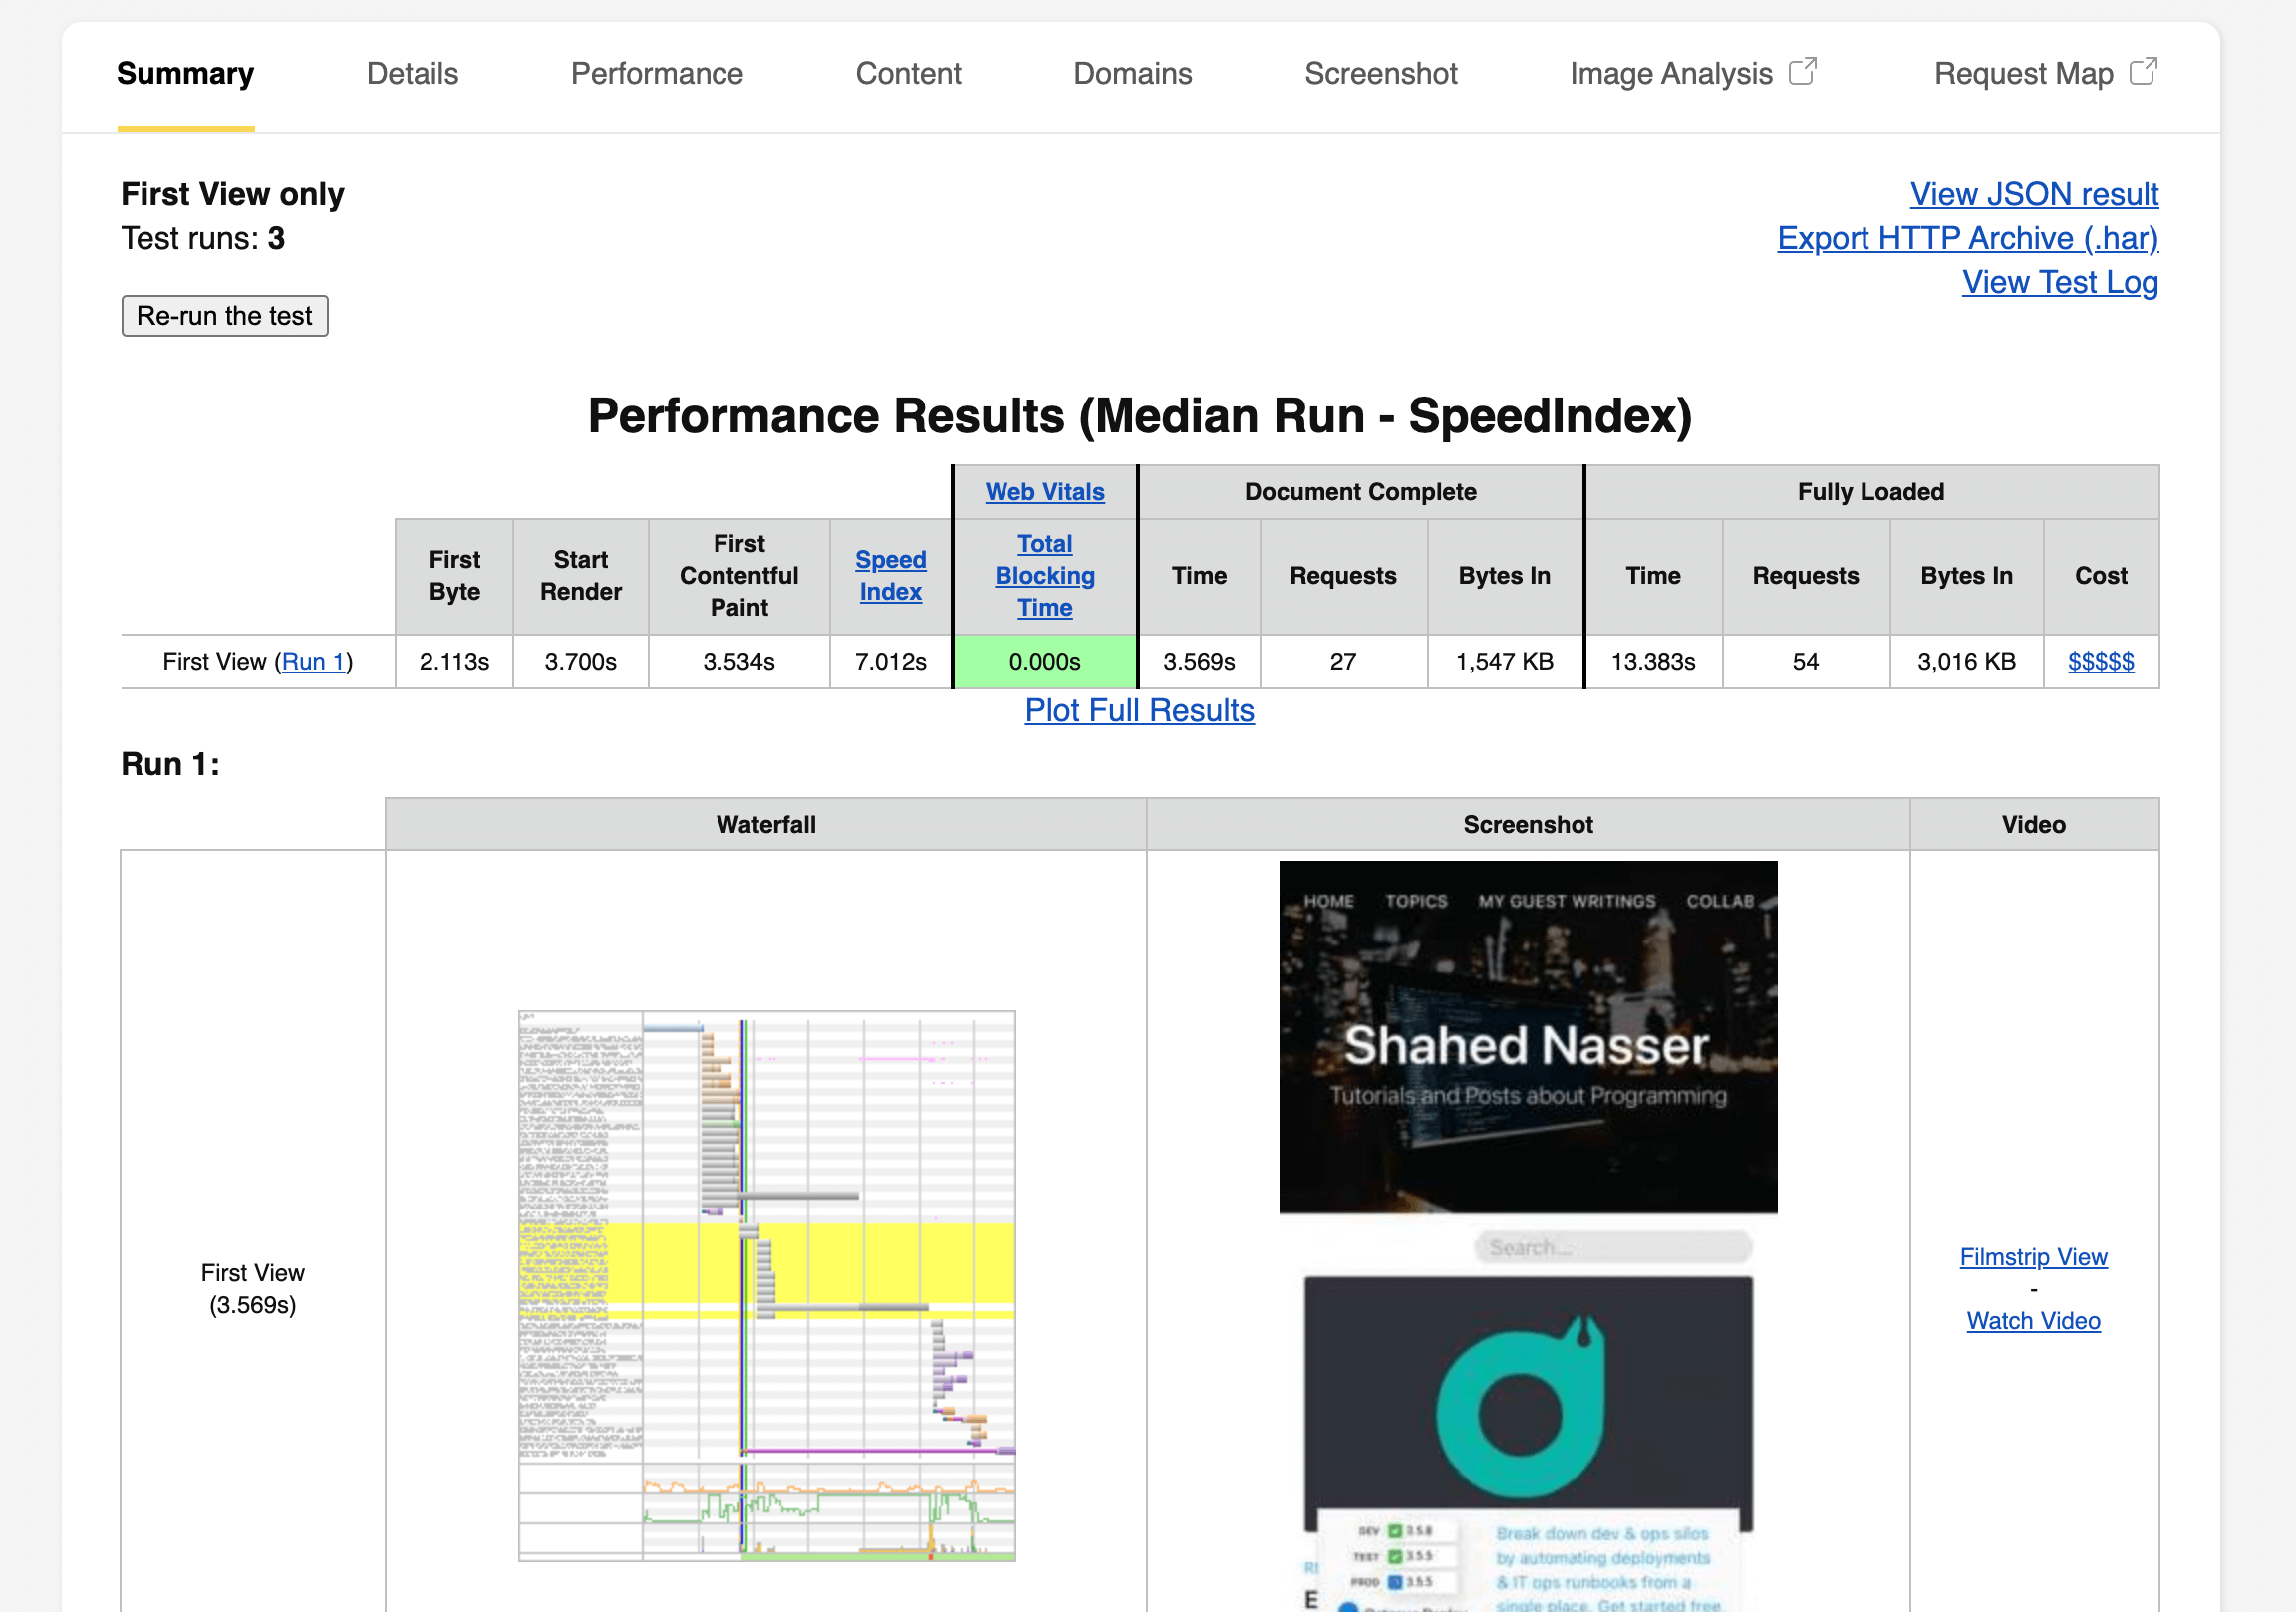
In addition to the summary, you can check more details by clicking on the Details tab. This will show details including how long each resource took to load, when they were loaded, what headers are used to load each of the resources, and more.
Under the Performance tab, you can see details regarding image compression, image formats, CDN assets, and more. You can use these details to determine how to improve the assets you’re using in your website, which can in turn improve the load time and performance of the website.
WebPageTest provides a lot more details regarding your website’s score and how it performs when using different devices, internet connection speeds, or any other factor that can affect a user’s experience or a website’s performance. This makes WebPageTest a great choice for detailed analysis of how your website performs under different conditions. It might be somewhat advanced for some developers, so using Lighthouse on Chrome is certainly easier.
Conclusion
Improving your website’s performance is an essential step during development. It shouldn’t be ignored or taken lightly. Providing a fast website that’s also accessible and performs well in search engines can boost your website’s traffic, and increase sign ups or sales. Lighthouse is a great open-source tool that provides thorough insights and analysis to help you improve your website and attract more users.
For more essential tips and advice about best practices to boost your website’s performance, be sure to check out SitePoint’s Jump Start Web Performance.
Frequently Asked Questions (FAQs) about Lighthouse
What is the primary function of Lighthouse in web development?
Lighthouse is a powerful tool in web development that helps developers improve the quality of their web pages. It is an open-source, automated tool designed for improving the performance, accessibility, and overall user experience of web pages. Lighthouse audits for performance, accessibility, progressive web apps, SEO, and more. It can be run against any web page, public, or requiring authentication.
How can I run Lighthouse on my web page?
Lighthouse can be run in several ways. The most common method is through the Chrome DevTools. Simply right-click on your webpage, select ‘Inspect’, then go to the ‘Lighthouse’ tab. You can also run Lighthouse as a Chrome Extension, as a Node module, or from the command line.
What are the key metrics that Lighthouse provides?
Lighthouse provides a variety of metrics to help developers understand the performance of their web pages. These include First Contentful Paint (FCP), Speed Index (SI), Largest Contentful Paint (LCP), Time to Interactive (TTI), Total Blocking Time (TBT), and Cumulative Layout Shift (CLS). Each of these metrics provides insights into different aspects of page load speed and user interaction.
How does Lighthouse score a web page?
Lighthouse scores a web page based on a weighted average of the metric scores. Each metric contributes a certain amount to the overall score. The weights of each metric may change from version to version of Lighthouse, but as of Lighthouse 6.0, the weights are as follows: Performance 45%, Accessibility 20%, Best Practices 15%, SEO 10%, and Progressive Web App 10%.
Can Lighthouse be used for mobile web page testing?
Yes, Lighthouse can be used for mobile web page testing. In fact, by default, Lighthouse’s performance audits are conducted as if they were run on a mid-tier device on a mobile network. However, you can also adjust the settings to simulate a desktop device if you prefer.
How can I improve my Lighthouse score?
Improving your Lighthouse score involves addressing the issues identified in the audit report. This could involve optimizing images, minifying CSS and JavaScript, removing render-blocking resources, improving server response times, and more. The specific actions will depend on the issues identified in your audit.
What is the difference between Lighthouse and other web page testing tools?
Lighthouse differs from other web page testing tools in that it is an open-source project maintained by Google. It provides a comprehensive set of audits for performance, accessibility, progressive web apps, and more, making it a one-stop-shop for web page testing.
Can Lighthouse be integrated with continuous integration systems?
Yes, Lighthouse can be integrated with continuous integration systems. This allows developers to catch and fix performance regressions before they hit production.
How often should I run Lighthouse audits?
The frequency of Lighthouse audits depends on the complexity and dynamism of your web page. However, it is generally recommended to run Lighthouse audits at least once for every major code change.
Can Lighthouse audits be automated?
Yes, Lighthouse audits can be automated. This can be done using the Lighthouse CI, an open-source command line tool that can be used to prevent regressions in website performance.
 Shahed Nasser
I am a full-stack developer passionate about learning something new every day, then sharing my knowledge with the community.