There is one universal rule which applies to all websites and applications: they must be fast. (A few years ago I would have stated sites should be responsive, although that word now has RWD connotations). Unfortunately, it’s evident that some developers are not concerned with site speed. If they did, multi-megabyte monstrosities would be rare and average page weights would never have exceeded 1Mb. It (almost) makes me long for the dial-up days when a 100Kb home page was considered excessive! A lightweight and fast user experience has never been more important. Mobile and web use in developing countries is increasing exponentially and fast broadband has never been plentiful or inexpensive. Trimming page fat is vital and so is optimizing your JavaScript performance. Fortunately, there are a number of easy ways to determine whether your scripts are causing significant delays.
Console Timing
Firebug, the Webkit Inspector, Opera Dragonfly and IE11 all support theconsole.time() and console.timeEnd() methods, e.g.
// start timer
console.time("DOM update");

// update
var p = document.getElementById("result");
for (var i = 0; i < 3000; i++) {
	p.textContent += i + " ";
}

// end timer
console.timeEnd("DOM update");console.time() and console.timeEnd(). You can have any number of timers running:
// start "DOM update" timer
console.time("DOM update");

// update
var p = document.getElementById("result");

// start "loop" timer
console.time("loop");
for (var i = 0; i < 3000; i++) {
	p.textContent += i + " ";
}
// end "loop" timer
console.timeEnd("loop");

// end "DOM update" timer
console.timeEnd("DOM update");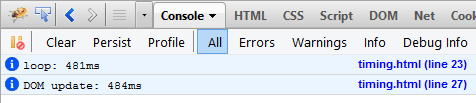
Profiling Timestamps
Another option is time-stamping. This is only available in Firebug and the Webkit Inspector — it records a point during execution, e.g.// record timestamp
console.timeStamp("DOM update started");
// update
var p = document.getElementById("result");
for (var i = 0; i < 3000; i++) {
p.textContent += i + " ";
}
// record timestamp
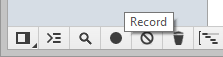
console.timeStamp("DOM update ended");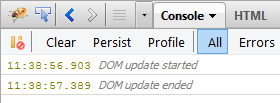 That may help a little, but the Webkit Inspector has a few more tricks. Click the Timeline tab followed by the Record icon in the lower-left of the window:
 Refresh your page then hit the Record icon again to stop recording. The time-line shows a visual representation of all events with your timeStamps marked in yellow in the timer bar:
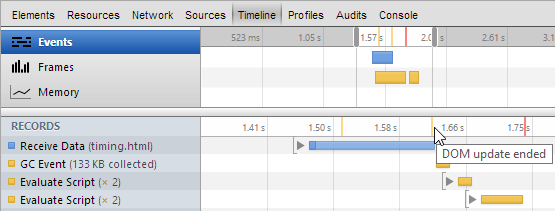 Very useful.
Removing Your Timers
Ideally, you should never leave console logging in production code. If you do, you’ll need to test whether the methods are available since they can cause errors in browsers where they’re not supported, e.g.if (console && console.timeStamp) console.timeStamp("My timestamp");console.time[^(]*("[^"]+");Frequently Asked Questions (FAQs) about JavaScript Performance and Developer Console
What is the purpose of the JavaScript console.trace() method?
The console.trace() method in JavaScript is a powerful debugging tool that provides a stack trace for a function. It gives you a detailed report of the sequence of function calls that led to the current point in your code. This can be incredibly useful when debugging complex code, as it allows you to trace the execution path and identify where errors or unexpected behavior may be originating.
How does the Performance.now() method work in JavaScript?
The Performance.now() method in JavaScript returns a high-resolution timestamp, measured in milliseconds, accurate to one thousandth of a millisecond. This timestamp can be used to measure the performance of your code, as it provides a precise measurement of the time taken to execute certain parts of your code. It’s particularly useful for benchmarking and performance analysis.
How can I use the console.trace() method effectively for debugging?
To use the console.trace() method effectively, you can insert it into your code at points where you want to check the call stack. When the browser executes this method, it will print a stack trace to the console, showing you the path the execution has taken to reach that point. This can help you identify any unexpected function calls or loops that may be causing issues.
What is the difference between console.trace() and console.log()?
While both console.trace() and console.log() are used for debugging, they serve different purposes. Console.log() simply outputs a message to the web console, whereas console.trace() provides a stack trace from the point in the code where it was called. This means console.trace() gives you more detailed information about the execution path of your code.
How does the High Precision Timing API enhance JavaScript performance measurement?
The High Precision Timing API provides methods for measuring time with a much higher degree of accuracy than traditional JavaScript timing methods. This allows for more precise performance measurements, which can be crucial when optimizing code for performance. The Performance.now() method, for example, provides a timestamp in milliseconds with microsecond accuracy, making it ideal for benchmarking and performance analysis.
What is the significance of the Performance API in JavaScript?
The Performance API in JavaScript provides an interface for retrieving performance-related information about the current page. It allows developers to measure the time taken for various parts of their code to execute, which can be invaluable for identifying bottlenecks and optimizing performance.
How can I use the Performance API to measure the execution time of my code?
To measure the execution time of your code using the Performance API, you can use the Performance.now() method to get a timestamp before and after the code you want to measure. The difference between these two timestamps will give you the execution time in milliseconds.
What are some common use cases for console.trace() in JavaScript?
Console.trace() is commonly used in debugging, particularly when dealing with complex code where it’s not immediately clear what the execution path is. By providing a stack trace, console.trace() allows you to see the sequence of function calls that led to a particular point in your code, which can be invaluable in identifying and fixing bugs.
How does console.trace() help in identifying and fixing bugs?
Console.trace() helps in identifying and fixing bugs by providing a detailed stack trace of the function calls leading up to a particular point in your code. This allows you to see exactly what the execution path was, and can help you identify any unexpected function calls or loops that may be causing issues.
Can I use the Performance API in all browsers?
The Performance API is widely supported in all modern browsers, including Chrome, Firefox, Safari, and Edge. However, it’s always a good idea to check the specific browser compatibility before using it, as there may be some differences in implementation or support between different browser versions.
 Craig Buckler
Craig is a freelance UK web consultant who built his first page for IE2.0 in 1995. Since that time he's been advocating standards, accessibility, and best-practice HTML5 techniques. He's created enterprise specifications, websites and online applications for companies and organisations including the UK Parliament, the European Parliament, the Department of Energy & Climate Change, Microsoft, and more. He's written more than 1,000 articles for SitePoint and you can find him @craigbuckler.