In a recent post we discussed the state of the art of data visualization in the browser – in particular, SVG libraries. There, we focused on Snap.svg, but we introduced Paths.js as a viable alternative – used together with a template engine or a data binding library. To be fair, Paths is capable of much more, as we are going to show in the following sections, with real use cases to walk you through its logic.
Introduction
Paths’ main purpose is to help front-end developers generate SVG paths with better performance via an intuitive interface. As the name suggests, despite having primitives for shapes like rect or circle, everything can be reduced to paths. This approach unifies different charts, providing a consistent interface where drawing commands always return a list of paths ready to be drawn. By replacing static template engines (such as Mustache or Handlebars) with data binding libraries such as Ractive.js, Angular or React, you can even get animated graphics for free.
Probably the best thing about Paths.js is that it offers three incremental APIs, with increasing levels of abstraction. The lowest level is a chainable API that generates an arbitrary SVG path. On top of this, paths for simple geometric shapes such as polygons or circle sectors are defined. The highest level API allows the generation of some simple graphs that can be fed with a collection of data. (Check out this demo to see the available primitives.)
Actually, strike that: Paths’ best feature is that you can use the library as is on the server-side with Node.js, since it doesn’t directly rely on any library1. This way, you can move the generation of chart structure and details onto the server. Besides speeding up apps, you can thus avoid sending raw data to the client altogether, saving latency and reducing the amount of information you share with clients.
Why Paths?
The greatest advantage of using Paths.js instead of — say — D3 or Snap.svg, is that the latter are imperative, while Paths inherently supports declarative programming when paired with template engines or (even better) data binding frameworks.
The use of Paths with frameworks like Ractive or React causes, in turn, another advantage. These frameworks, in fact, use specific optimizations to reduce the number of reflows and repaints needed every time the DOM has to be modified; they keep “shadow” copies of the DOM, against which they perform the update in a sort of “batch mode”, and finally update the real DOM with the fewest number of changes possible.
Another area where these frameworks make a difference is in event handling. By default, they use event delegation, improving performance in those situations where the same event is attached to a series of elements. The solution is simply to attach these event handlers to some common container of the elements, but it is far too easy to overlook such a pattern when an imperative approach is used (with dire consequences – such as unresponsive pages).
Finally, Paths is lightweight and modular: you can load just the components you actually need, focusing on charts, or just SVG manipulation. Paths is one of those libraries that focus on a few things, trying to optimize them. In general, you can combine a bunch of these kinds of libraries together to perform complex tasks. D3, on the other hand, has many extra utility methods – which is great if you need them, since you have everything you need in one place, but a bit heavy if you don’t.
Using Paths
As mentioned, you can use Paths with Node.js or on the browser. In the latter scenario, you can either load it as AMD modules or as a standalone library.
Paths on Node
If you want to use it on the server, first install it by typing this command on your console (assuming you have correctly installed node and it is in the global path):
npm install paths-js
Once installed, you can load the individual modules:
var Pie = require('paths-js/pie');Paths on the Browser: AMD Modules
Paths.js is distributed with Bower, and you can install it from the command line:
bower install paths-js
Or, of course, just download it manually from its repository on GitHub.
Paths is structured into various AMD modules, and can be loaded with AMD module loaders. Using RequireJS (assuming you have installed Paths with Bower), this how you can configure it:
require.config({
  'paths': 'components/paths-js/dist/amd'
});
The actual path will depend on your Bower configuration or, for manual downloads, on the structure of your folders. (Be careful where you place the amd folder linked above.)
After configuring it correctly, you can easily require individual modules:
var Pie = require('paths/pie');Paths on the Browser: Standalone Script
If you prefer to avoid AMD modules, you can safely include Paths as a standalone script: the file you need is dist/global/paths.js. Once it is included in your page, the paths object will be available in the global scope, so that the individual modules will be available as paths.Pie, paths.Polygon and so on. Besides verbosity, you lose the ability to import only the modules you need – but if you need many of them, this will have a negligible impact.
Low-Level API
The lowest level API target, as mentioned, is creating paths. Targets creation is as easy as calling one constructor: Path(). The whole API is chainable, so that you can create a complex path by invoking methods on the result of previous calls. Path objects offer methods to extend the current path incrementally; a reference to the last point in the path is kept, and lines or curves can be added from that point, mimicking the SVG syntax for paths. The main methods you will need are:
moveto(x, y): moves the cursor to the coordinates passed.lineto(x, y): draws a line from the end of the path to those coordinates.curveto(x1, y1, x2, y2, x, y): draws a cubic Bézier curve from the current point to (x,y) using (x1,y1) as the control point at the beginning of the curve and (x2,y2) as the control point at the end of the curve.smoothcurveto(x2, y2, x, y): draws a cubic Bézier curve from the current point to (x,y), implicitly computing the first control point based on the second one and the previous command (if any).arc('rx', 'ry', 'xrot', 'large_arc_flag', 'sweep_flag', 'x', 'y'): draws an elliptical arc from the current point to (x, y), controlling ellipse radii and rotation through the other parameters.closepath(): closes the path, turning it into a polygon.
All the methods available support a “verbose” API as well, so that named parameters (in the form of a configuration object) can be passed to each of them seamlessly. For example, the moveto method above can be called as Paths().moveto({x: 10, y: 3}) or Paths().moveto(10, 3). The names of the parameters follow the SVG specification.
More methods are available, and in general there is a one-to-one matching with SVG Paths commands. For example, qcurveto(x1, y1, x, y) and smoothqcurveto(x, y) are the analogous to curveto smoothcurveto for quadratic curves.
In general, this works better with a template engine, but it isn’t strictly necessary. You can use Paths with an imperative style, as the next examples demonstrate. However, this is not the best practice:
<title>PathsJs test</title>
    <style type="text/css">
      .ocean {
        fill: blue;
      }
    </style>

    <svg width="640px" height="480px"><path id="testpath" class="ocean"></path></svg>

    <script type="text/javascript" src="lib/paths.js"></script>
var Path = require('paths/path');
var path = Path()
.moveto(10, 20)
.lineto(30, 50)
.lineto(25, 28)
.qcurveto(27, 30, 32, 27)
.closepath();
document.getElementById("testpath").setAttribute("d", path.print());The print() method of Path objects translates the path constructed into the corresponding SVG data string, as it would appear in the d (data) attribute of paths. Once we obtain that value, we can manually set the proper attribute on any path just using CSS selectors and the getElementById / getElementsBy* methods.
Of course, using a template engine would greatly impact the amount of boilerplate code we need to write:
<svg width="640px" height="480px"><path d="{{ path.print() }}" fill="blue"></path></svg>This removes the need to manually set a d attribute for #testpath, and even to assign an id to the path element. This is the best practice style for creating SVG drawings with Paths.
Mid-Level API
Powerful as it is, in practice you’ll seldom need the low-level API. The reason is that Paths offers an API built upon it, with a higher level of abstraction, that allows you to directly create polygons and shapes with an intuitive syntax.
Before we look at an example, it’s important to understand how this API works. We have already stated how everything produced by this library is a path. Indeed, each of the mid-level API methods returns an object with two fields:
{
  path: <path object="">
  centroid: [<x>, <y>]
}
The path field contains a Path object, compliant with the low-level API, and so is extendable: a string describing the path’s data attribute can be retrieved, as usual, with its print() method.
The centroid field, instead, isn’t formally related to the path produced, but, nonetheless, it can be very useful: it is empirically computed to be a point somehow central to the figure, that can be used, for example, to position a label for the shape.
To appreciate the difference between the two levels of abstraction, we’ll create a polygon almost identical to the previous section, this time using the Polygon object:
<svg width="640px" height="480px"><path id="testpath" class="ocean"></path><path id="testpath2" class="ocean" transform="translate(100)"></path></svg>var Polygon = require('paths/polygon');
var polygon2 = Polygon({
points: [[10, 20], [30, 50], [25, 28], [32, 27]],
closed: true
});
document.getElementById("testpath2").setAttribute("d", polygon2.path.print());If you test this code, you’ll see that the two shapes look pretty similar at first sight. The difference is that the first one, built with the low-level API, has one side built with a quadratic curve instead of a segment. The low-level API, indeed, has the advantage of allowing you to mix different types of lines in the same shape.
With the mid-level API there isn’t such a method that allows you to conveniently mix them. But fear not, nothing is lost: as we said, you can always edit the Paths returned by Polygon(...):
<svg width="640px" height="480px"><path id="testpath" class="ocean"></path><path id="testpath2" class="ocean" transform="translate(100)"></path><path id="testpath3" class="ocean" transform="translate(50)"></path></svg>var polygon3 = Polygon({
points: [[10, 20], [30, 50], [25, 28]],
closed: false
});
console.log(polygon3.path.print())
var polygon3Path = polygon3.path
.qcurveto(27, 30, 32, 27)
.closepath();
document.getElementById("testpath3").setAttribute("d", polygon3Path.print());The full list of Objects available for level two interface is:
- Polygon: closed and opened polygons.
- Semi-regular polygon: a special case of polygon: allows creation of triangles, squares, pentagons etc. (regular polygons and their irregular variants). It is defined with respect to a center, and the angles between the segments from the center to the points are all the same, while the distances of these points can be constant (regular polygons) or they can vary (irregular ones).
- Rectangle: another special type of polygon, although this time more intuitive.
- Bezier: draws a smooth Bezier curve passing through a list of vertices. The path returned is always open.
- Sector: a circular sector.
- Connector: defined as an S-shaped path between two given points. (The best way to understand it is to give it a try.)
A couple of examples to better show semi-regular polygons:
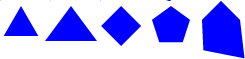
Triangle (Equilateral)
var SemiRegularPolygon = require('paths/semi-regular-polygon');
var triangle = SemiRegularPolygon({
  center: [50, 50],
  radii: [20, 20, 20]
});
document.getElementById("triangle").setAttribute("d", triangle.path.print());
Triangle (Isosceles)
var triangleIrregular = SemiRegularPolygon({
  center: [50, 50],
  radii: [20, 30, 30]
});
Square
var square = SemiRegularPolygon({
  center: [50, 50],
  radii: [20, 20, 20, 20]
});
Pentagon
var pentagon = SemiRegularPolygon({
  center: [50, 50],
  radii: [20, 20, 20, 20, 20]
});
Pentagon (Irregular)
var pentagonIrregular = SemiRegularPolygon({
  center: [50, 50],
  radii: [25, 20, 40, 30, 20]
});
High-Level API
This is the highest level API provided by Paths. The purpose of its methods is to allow for the creation of full charts starting from the dataset to be visualized. As always, everything is translated to a path! In particular, all of these methods return an object containing a curves field, an array with the shapes created for each data point. The shapes in curves are objects with a few relevant fields:
item: a reference to the corresponding data item.index: the index of the corresponding data item in the data array.- One or more fields containing shape objects (such as
sectorfor pie graphs, andlineandareafor line charts).
The returned objects might have extra fields besides curves, depending on each chart. But every chart method accepts a compute argument in input. This parameter allows users to pass in any number of functions to compute extra fields based on input data. (Computing colors would be a typical example.)
When using these high-level methods, template engines are almost a must, because they spare developers a lot of boilerplate code. They also simplify chart creation by automating iteration over the set of shapes of a complex chart.
As always, however, they are not strictly needed. Let’s see an example of how it is possible to make do without them:
<svg id="chart-test" width="200px" height="200px"></svg>var somePalette = ['blue', 'green', 'red', 'yellow', 'orange'],
Pie = require('paths/pie'),
pie = Pie({
data: [
{ name: 'Italy', population: 59859996 },
{ name: 'Mexico', population: 118395054 },
{ name: 'France', population: 65806000 },
{ name: 'Argentina', population: 40117096 },
{ name: 'Japan', population: 127290000 }
],
accessor: function(x) { return x.population; },
compute: {
color: function(i) { return somePalette[i]; }
},
center: [50, 50],
r: 30,
R: 50
}),
chartSvg = document.getElementById("chart-test"),
chartFragment = document.createDocumentFragment(),
dx = parseInt(chartSvg.getAttribute('width'), 10) / 2,
dy = parseInt(chartSvg.getAttribute('height'), 10) / 2;
pie.curves.forEach(function (d, i){
var path = document.createElementNS('https://www.w3.org/2000/svg',"path");
path.setAttributeNS(null, 'd', d.sector.path.print());
path.setAttributeNS(null, 'style', 'fill:' + d.color);
var label = document.createElementNS('https://www.w3.org/2000/svg',"text");
label.textContent = d.item.name;
label.setAttributeNS(null, 'x', d.sector.centroid[0]);
label.setAttributeNS(null, 'y', d.sector.centroid[1]);
chartFragment.appendChild(path);
chartFragment.appendChild(label);
});
chartSvg.appendChild(chartFragment);In the code above, we use a code fragment to gather all sectors before actually adding them to the page – and thus triggering reflow only once, instead of twice for each sector (once for the path and once for the label). Document fragment elements are inserted in one go, while, if we had used an svg:g element to group them, each node would have been inserted individually. (Moreover, there would be the possibility of a redundant group in the resulting SVG.) An even greater advantage of document fragments is that if we need to clone the whole chart and add it multiple times to the page, each cloning operation requires a constant number of node insertions instead of a linear number of them.
Now, let’s compare the previous code with the creation of the same graph as above using Ractive:
<div id="pie-chart"></div><script id="myChartTemplate" type="text/ractive">
  <svg width=375 height=400>
      {{# pie }}
        {{# curves:num }}
            <path on-click="expand" d="{{ sector.path.print() }}" fill="{{ color }}" ></path>
            <text text-anchor="middle" x="d.sector.centroid[0]" y="d.sector.centroid[1]">{{ item.name }}</text>
          </g>
        {{/ curves }}
      {{/ end of pie}}
  </svg>
</script>
var Pie = require('paths/pie');
var ractive = new Ractive({
el: 'pie-chart',
template: '#myChartTemplate',
data: {
pie: Pie({
data: [
{ name: 'Italy', population: 59859996 },
{ name: 'Mexico', population: 118395054 },
{ name: 'France', population: 65806000 },
{ name: 'Argentina', population: 40117096 },
{ name: 'Japan', population: 127290000 }
],
accessor: function(x) { return x.population; },
compute: {
color: function(i) { return somePalette[i]; }
},
center: [50, 50],
r: 30,
R: 50
})
}
});The result looks nicer, cleaner, and the structure of the chart is immediately evident by looking at the markup.
There are currently 9 different types of chart available:
- Pie Chart
- Bar Chart: allows multiple histograms to be drawn side by side.
- Stock Chart: represent one or more time-series with line charts.
- Smooth Line Chart: like Stock Charts, but it interpolates the lines between the data points using smooth Bezier curves.
- Radar Chart
- Tree Chart
- Waterfall Chart: a bar chart that allows breaking down values in pieces.
- Force Directed Chart: a physical simulation in the form of a graph, with vertices repelling each other unless they are connected by an edge.
- Sankey Diagram: flow diagrams, where arrows are proportional to the flow.
You can take a look at the Paths [showcase](http://andreaferretti.github.io/paths-js-demo/) to see what these charts look like. All the examples presented there exploit Ractive to easily create awesome animations.
Conclusion
At this point, you might be asking if Paths is indeed the right choice for you. There is, of course, no simple answer to that. It depends. If you need off-the-shelf widgets and charts, probably no – you might be better off with Highcharts, Flotcharts or Dimple.
However, we can’t stress enough the advantages of adopting a declarative style of programming in data-visualization. If you use Paths imperatively, the result probably won’t be worth the effort of learning a new library.
Paths is helpful where you need to create custom charts with personalized styling or animation, or custom behavior in response to user interaction. But Paths is a real game changer where you need to generate graphics on the server. Paths makes it extremely easy for you to generate the markup in the logic and send it to the client as JSON or strings.
Finally, here are some links for further reading:
- A CodePen for the code samples in this article.
- My slideshow on data visualization for the browser: Reactive SVG charts with Ractive.js.
- Paths-js home on GitHub.
- Slides for a talk by Andrea Ferretti on functional approach to visualization in the browser.
- Paths.js just depends on core EcmaScript 5 methods, which is a problem for older browsers. This polyfill adds the necessary support. ↩
 Marcello La Rocca
I'm a full stack engineer with a passion for Algorithms and Machine Learning, and a soft spot for Python and JavaScript. I love coding as much as learning, and I enjoy trying new languages and patterns.