There is no doubt: HTML5 and CSS3, and their related APIs, are hot stuff. In this article I will show how you can use these technologies to create a complete and functional environmental thermometer.
The Ingredients
An HTML5 environmental thermometer is a simple and adaptive thermometer that allows you to gauge the temperature of a chosen location. This demo uses semantic HTML5 markup, CSS3 and JavaScript for styling and positioning the thermometer in order to make it look like a real environmental thermometer. Since it uses an SVG background image, it can be adapted to different sizes without being stretched. However, in the folder that contains the source code there’s also a PNG background image to support older browsers which don’t support SVG. So, in full, here are the various technologies we’ll be using:- HTML5 for the markup
- CSS3 to style the thermometer
- JavaScript and jQuery to adjust the thermometer position and to set and position its labels
- SVG for the background to be adaptive
- Polyfill to support the browsers that don’t support the tag (jonstipe/meter polyfill is used)
- Geolocation API to get the user’s position
- Google Maps API to convert the geolocation into an address
- Yahoo! Weather API to retrieve the WOEID code and the temperature
How it Works
Using this thermometer is very simple. To retrieve the temperature, you have to write the name of a city — or even better, an address — in the related field (for example, “Naples” as shown below), and click the button reading “Get temperature!”.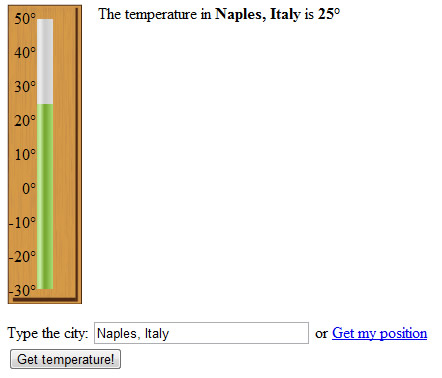 As soon as the temperature is retrieved, you’ll see the meter bar rising (or falling, depending on the case) until the correct measure is reached and the relevant information, on the upper right-hand side, is autofilled with the data. In the case where you need the temperature of your current location, you can simply take advantage of the Geolocation API used in the code. So, all you need to do is to click on “Get my position” and the field will be automatically filled with your current position (to be honest, it is an approximation).
Let’s Analyze the Code
In this section I won’t explain the entire code, but just the most interesting parts of it; some of the CSS rules or JavaScript lines are just complementary to the core.HTML5
The markup underpinning the thermometer is quite simple:<div id="thermometer-wrapper">
<meter id="thermometer" min="-30" max="50" value="0"></meter>
<div id="labels"></div>
</div>
<div id="info"> The temperature in <label id="city">-</label> is <output id="temperature" form="request">-</output>
<label id="error"></label>
</div>
<form id="request" name="request" action="#">
<label>Type the city:</label>
<input type="text" id="location" name="location" size="30" placeholder="Frattamaggiore, Italy" required="required"/> or <a id="my-position" href="#">Get my position</a>
<br />
<input type="submit" name="submit" value="Get temperature!" />
</form> div delimits the area in use and it is used to attach the background image. The second line shows a meter tag which is the actual element used for the thermometer. The meter tag gives the demo a pinch of semantic meaning, which is never a bad thing. The third line contains the labels attached to the thermometer, but they will be created on-the-fly using JavaScript.
The remaining code is used to show the info in a written form and to request the user location. The important tags and attributes here are the output tag, inside the inner div, to show the current temperature which is attached to the form; as well as the required and placeholder attributes of the location field.
CSS3 and SVG
CSS3 is not used only to style the code simply, but to transform the markup into a real environmental thermometer. The background image is an SVG which means that it will render well and determine if the dimensions of the demo will change. Here, I used the CSS3 rulebackground-size.
#thermometer-wrapper {
  background-image: url('background.svg');
  background-repeat: no-repeat;
  position: relative;
  height: 300px;
  width: 75px;
  float: left;
  margin: 0em 1em 1em 0em;
  -ms-background-size: cover;
  -webkit-background-size: cover;
  -moz-background-size: cover;
  -o-background-size: cover;
  background-size: cover;
}metertag is rotated 90 degrees to be displayed vertically. This, however, brings a problem with both sizing and centering the element inside the div. The sizing problem arises from the fact that, being displayed vertically, to prolong the bar, we have to change the height attribute. Unfortunately, in order to work as expected, this change has to be done after the bar is rotated and so this is done via JavaScript. For the same reason, centering the bar is a problem that has to be solved programmatically using JavaScript — in particular, jQuery. The transform rule is the only CSS3 rule used on the element, as shown below:
#thermometer {
  position: absolute;
  transform: rotate(-90deg);
  -ms-transform: rotate(-90deg);
  -webkit-transform: rotate(-90deg);
  -o-transform: rotate(-90deg);
  -moz-transform: rotate(-90deg);
}
JavaScript and jQuery
JavaScript plays an important role in this demo. Infact, since CSS is not sufficient to center the thermometer, JavaScript has to be used. Moreover, the latter has been used to set the number of labels dynamically and to evenly space things. Even if the dimensions of the wrapper of the thermometer are changed, the labels will be adapted proportionally. The relevant part of code is:// Calculates the space between each label
margin = (thermometer.width() + (parseFloat(labels.css('font-size')) / 2)) / ((max - min) / step);
margin -= parseFloat(labels.css('font-size'));font-size. Here’s how you center the bar:
// Calculates the position of the thermometer
thermometer.width(0.9 * wrapper.height());
thermometer.css('bottom', ((wrapper.height() - thermometer.height()) / 2) + 'px');
thermometer.css('left', (thermometer.width() - wrapper.width()) / -2);
The APIs
In this demo I used several APIs. The Geolocation API is used to retrieve the user’s position; this data is immediately sent to the Google Maps API to retrieve an address from the coordinates. Finally, the Yahoo! Weather API is used to retrieve the WOEID (Where on Earth Identifier) and get the current temperature of the location requested. That’s a basic look at the markup and script used to create this environmental thermometer. Take a look at the online demo, and download the source code, check it out for yourself and feel free to have a play around with it. (The HTML5 environmental thermometer is completely open source and released dual licensed under the MIT and the GPL-3.0 licenses.)Frequently Asked Questions (FAQs) on Creating Your Own HTML5 Environmental Thermometer
How Can I Customize the Thermometer to Suit My Website’s Design?
Customizing the thermometer to suit your website’s design is quite straightforward. You can modify the CSS properties to match your website’s color scheme and overall design. For instance, you can change the color of the thermometer, adjust its size, or even modify its shape. You can also add animations or transitions to make the thermometer more interactive. Remember, the key is to maintain consistency with your website’s design to ensure a seamless user experience.
Can I Use This Thermometer on a Mobile Device?
Yes, the HTML5 environmental thermometer is designed to be responsive, meaning it can adapt to different screen sizes, including mobile devices. However, you may need to adjust the CSS properties to ensure the thermometer displays correctly on smaller screens. You can use media queries to make these adjustments based on the device’s screen size.
How Can I Add More Features to the Thermometer?
Adding more features to the thermometer involves modifying the JavaScript code. For instance, you can add a feature that allows users to switch between Celsius and Fahrenheit. You can also add a feature that updates the temperature in real-time using an API. Remember, when adding new features, ensure they enhance the user experience and do not clutter the interface.
How Can I Integrate the Thermometer with a Weather API?
Integrating the thermometer with a weather API involves making an HTTP request to the API and updating the thermometer based on the response. You can use the fetch API or the XMLHttpRequest object to make the request. Once you receive the response, you can parse the JSON data and update the thermometer’s value accordingly.
Can I Use the Thermometer to Display Other Types of Data?
Yes, while the thermometer is designed to display temperature, you can modify the JavaScript code to display other types of data. For instance, you can use the thermometer to display the progress of a task, the level of a resource, or even the score in a game. The key is to ensure the data is represented accurately and intuitively.
How Can I Improve the Performance of the Thermometer?
Improving the performance of the thermometer involves optimizing the JavaScript code and the CSS properties. For instance, you can minimize the number of DOM manipulations, use CSS transitions instead of JavaScript animations, and ensure the CSS properties are GPU-accelerated. You can also use performance profiling tools to identify and fix any performance bottlenecks.
How Can I Make the Thermometer More Accessible?
Making the thermometer more accessible involves adding ARIA attributes and ensuring the color contrast is sufficient. For instance, you can add the aria-valuemin, aria-valuemax, and aria-valuenow attributes to the thermometer to indicate its current value. You can also use a color contrast checker to ensure the thermometer is visible to users with color vision deficiencies.
Can I Use the Thermometer in a Commercial Project?
Yes, you can use the thermometer in a commercial project. However, you should ensure you understand and comply with the license terms of any third-party libraries or APIs you use. You should also test the thermometer thoroughly to ensure it works correctly and provides a good user experience.
How Can I Add the Thermometer to My Website?
Adding the thermometer to your website involves copying the HTML, CSS, and JavaScript code to your website’s source code. You should place the HTML code where you want the thermometer to appear, link the CSS file in the head section of your HTML file, and link the JavaScript file at the end of the body section. You should also ensure the paths to the CSS and JavaScript files are correct.
Can I Use a Different Programming Language to Create the Thermometer?
While the tutorial uses HTML5, CSS, and JavaScript, you can use other programming languages to create the thermometer. For instance, you can use PHP or Python on the server-side to fetch the temperature data and generate the HTML code. However, you will still need to use CSS for the styling and JavaScript for the interactivity.
 Aurelio De Rosa
I'm a (full-stack) web and app developer with more than 5 years' experience programming for the web using HTML, CSS, Sass, JavaScript, and PHP. I'm an expert of JavaScript and HTML5 APIs but my interests include web security, accessibility, performance, and SEO. I'm also a regular writer for several networks, speaker, and author of the books jQuery in Action, third edition and Instant jQuery Selectors.


