
Google web services have become an essential part of many projects’ infrastructure, a vital integration element. We can no longer imagine online services without them. Meanwhile, Google developers are working on expanding the capabilities of their services, developing new APIs, and increasing the security of our data. Usually, updates are released smoothly for users and do not require any changes on your side. But not this time with the new Google Sheets API.
Key Takeaways
Preface: Progress Is a Pain
In 2021, Google introduced version 4 of its Sheets API, which is incompatible with the previous one. This affected data security and privacy. Sheets API v3 support was extended until August 2021 to provide developers with more time to migrate to the new API version. Since the end of support for the v3 API, many JavaScript developers have faced migration issues. And although Google provided a detailed migration guide, as it usually happens, several crucial details are missing from it.
As a support engineer at AnyChart, I have received and continue to deal with numerous requests for help from our JS charting library users who suddenly faced issues with feeding visualizations with data from their Google spreadsheets. It shows the problem has been and remains really topical. So I decided to make a quick Google Sheets API v4 integration guide for anyone else out there.
This article showcases a basic approach to accessing a spreadsheet document on Google Sheets and loading the data from it as apparently the most common use case.
Accessing Google Spreadsheets from JavaScript
To access a Google Sheets spreadsheet from the JavaScript code, you need google-api-javascript-client and Sheets API, as well as a configured Google project and a document itself.
Let me walk you through all this step by step.
Configuration on Google Side
1) Create a project
- Go to the Google Cloud Platform:
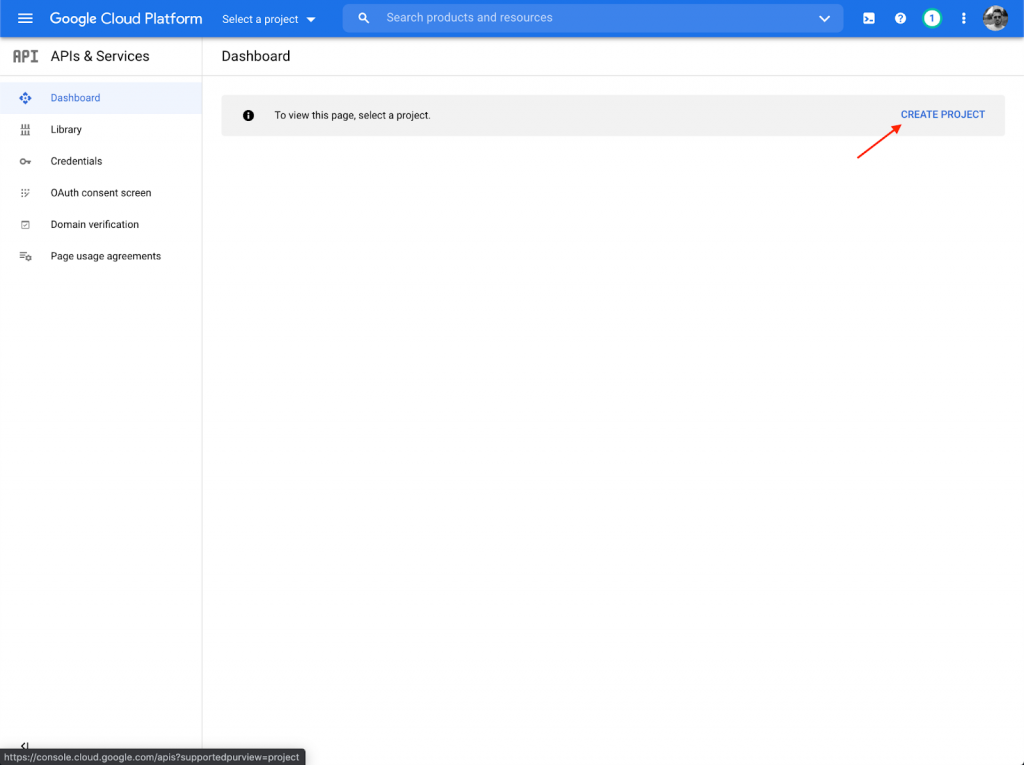
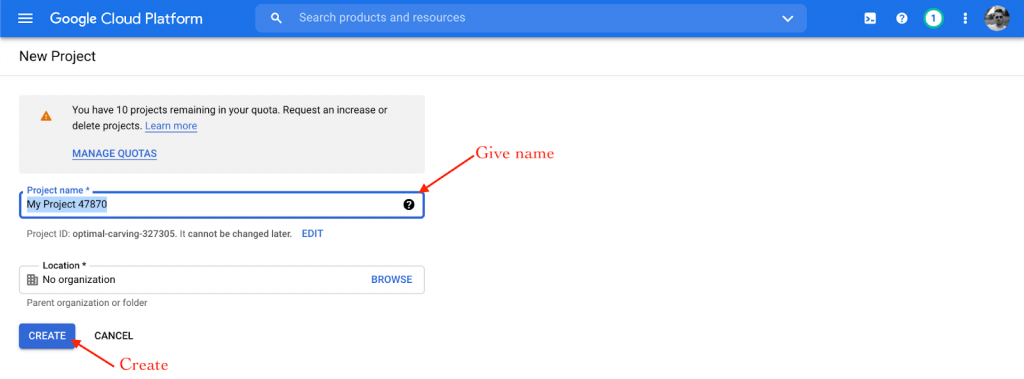
- Create a new project:
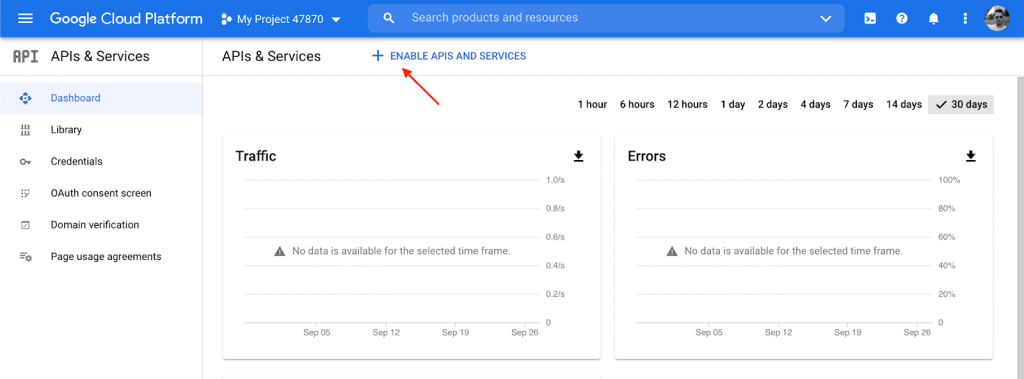
2) Enable API
- Go to “Enable APIS and services”:
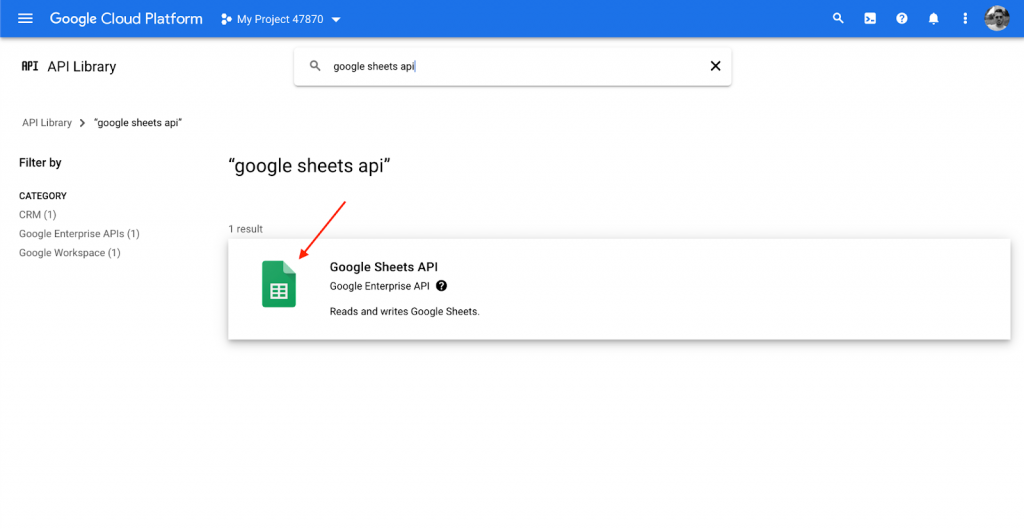
- Type “google sheets” in the search field to find the API:
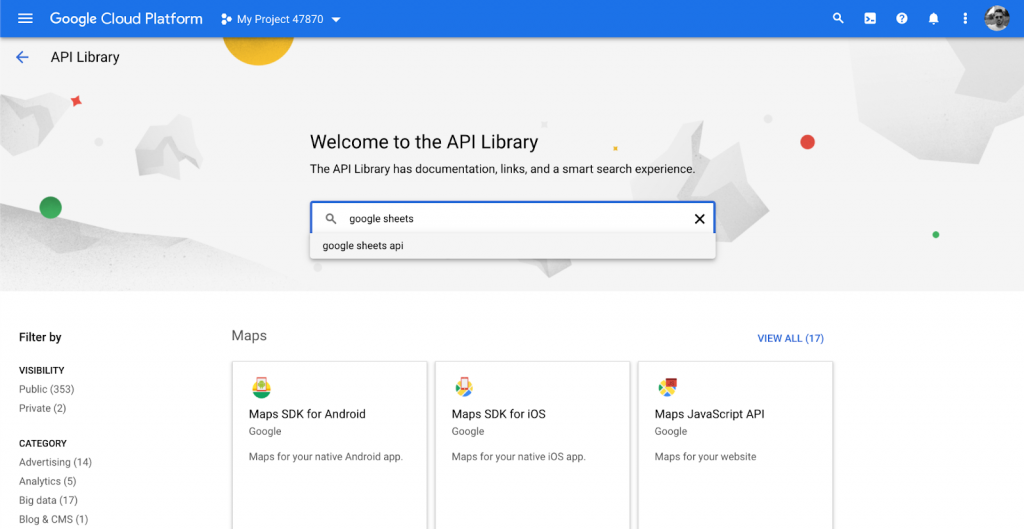
- Select “Google Sheets API”:
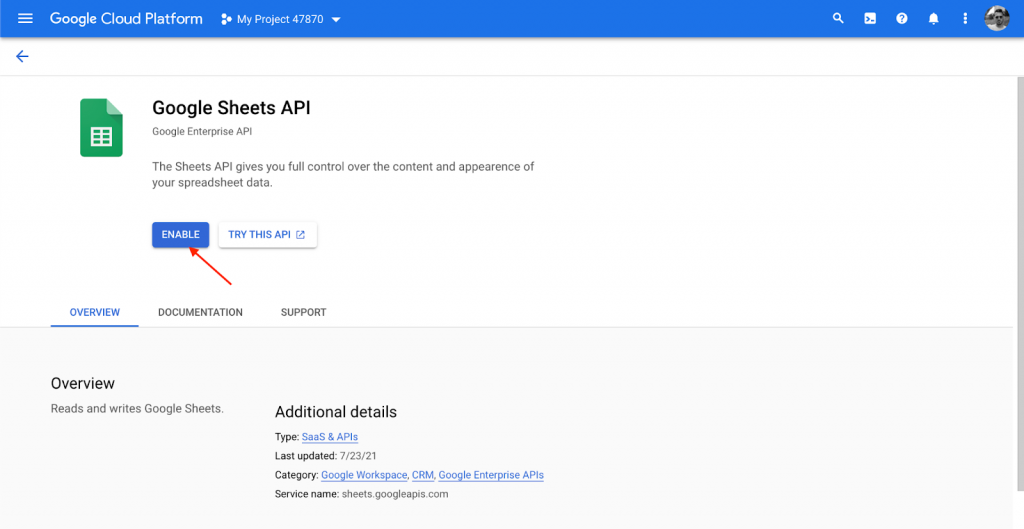
- Enable the Google Sheets API:
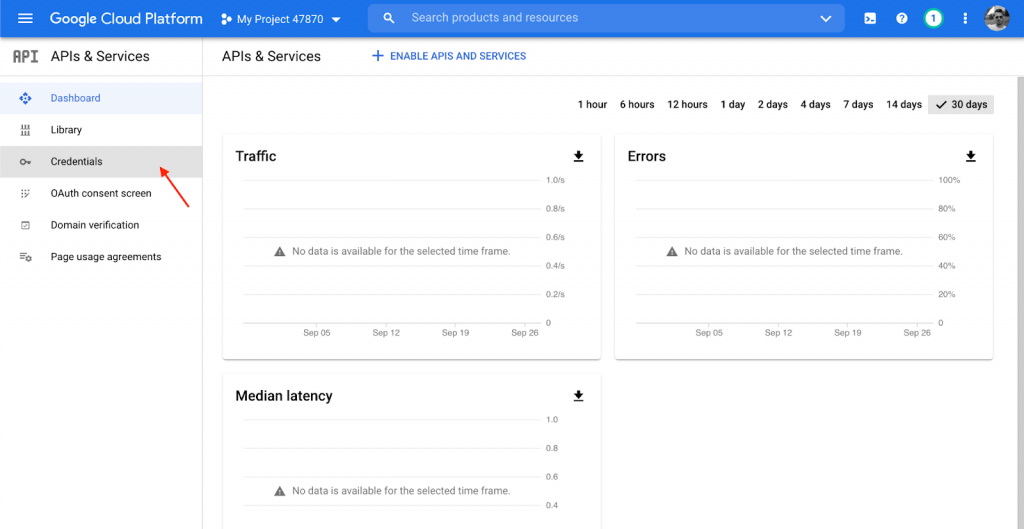
3) Credentials
- Go to the “Credentials” tab:
- Click “Create credentials” and select “API key”:
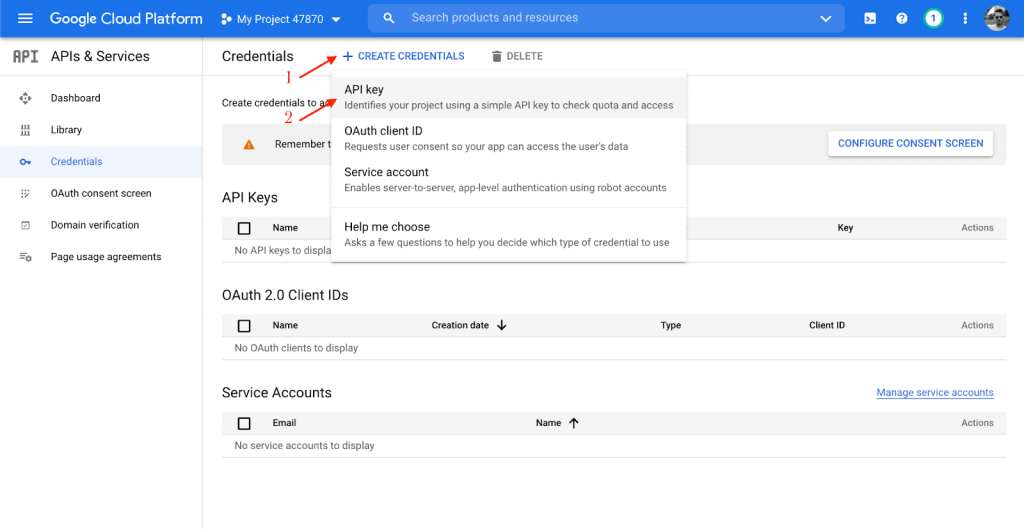
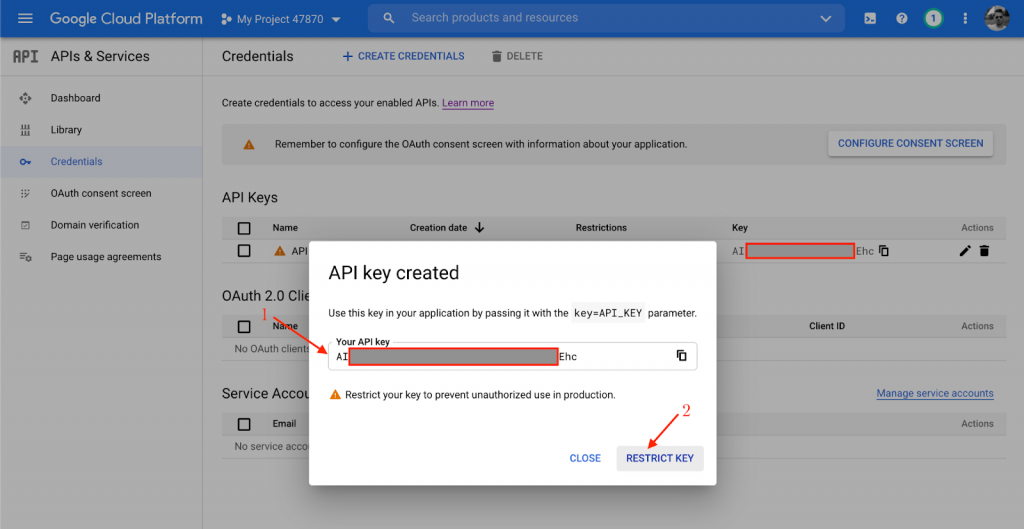
Note: Copy and store the API key. You will need it in the JavaScript code later ({GOOGLE_API_KEY} in the JS code).
c) Click “Restrict key”:
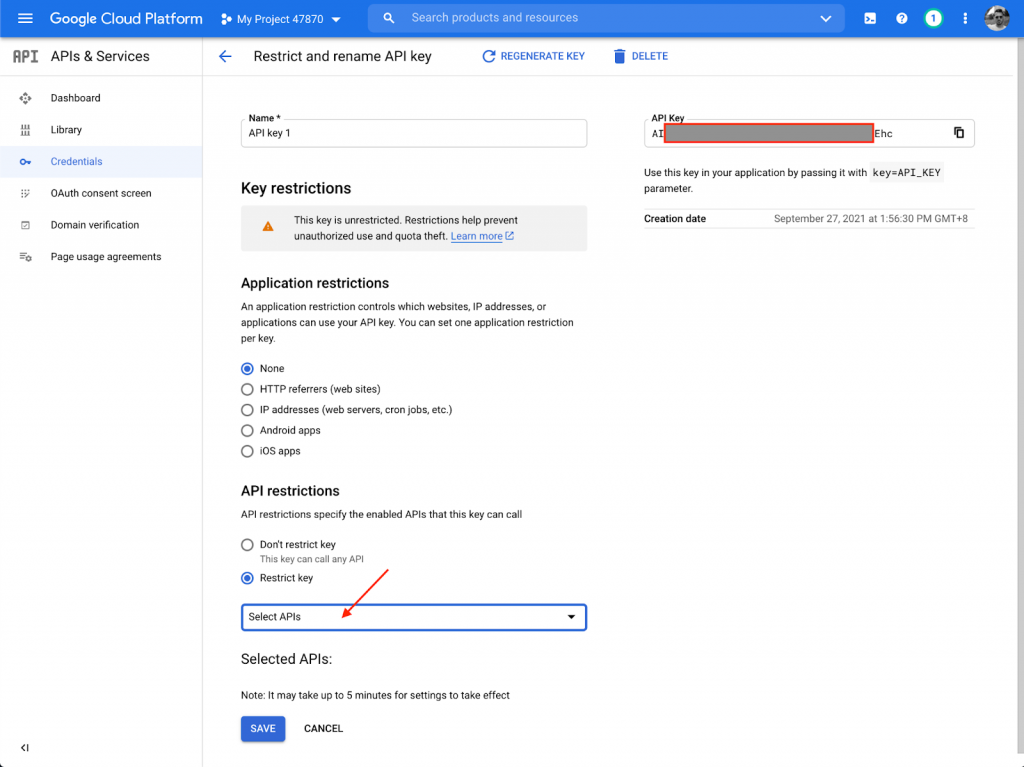
Note: Keep your API keys secure during both storage and transmission. Best practices for this are well covered by Google in this article. All the code snippets below are simplified for demonstration purposes and do not describe security aspects.
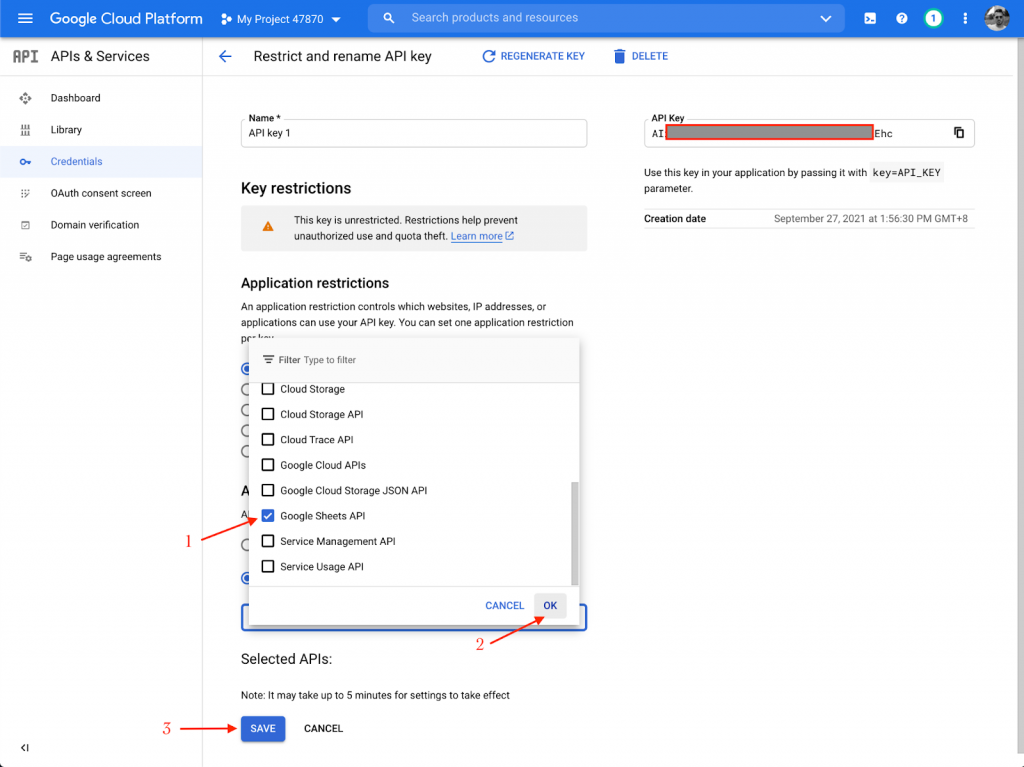
d) In the “Restrict key” dropdown menu, locate the “Google Sheets API” item:
e) Select it, click “OK” and “SAVE”:
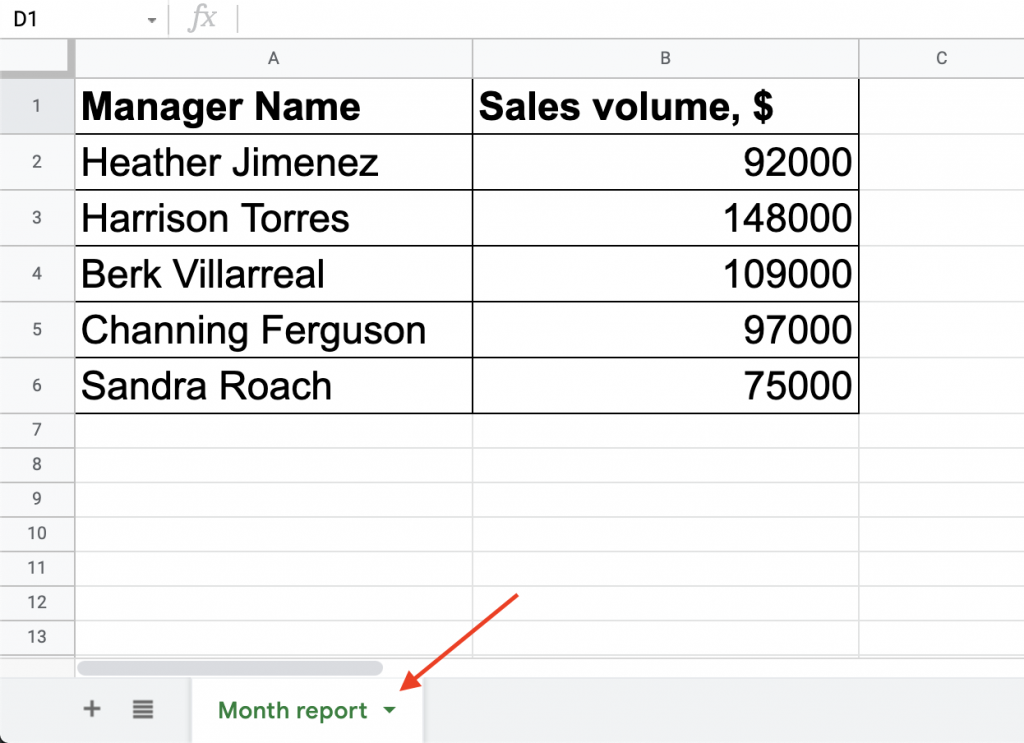
4) Create a document
- Create a Google Sheets document the way you usually do and fill it with some data. Set a name for the sheet with your data or copy the default one — it will be required later in the JS code ({SHEET_NAME}).
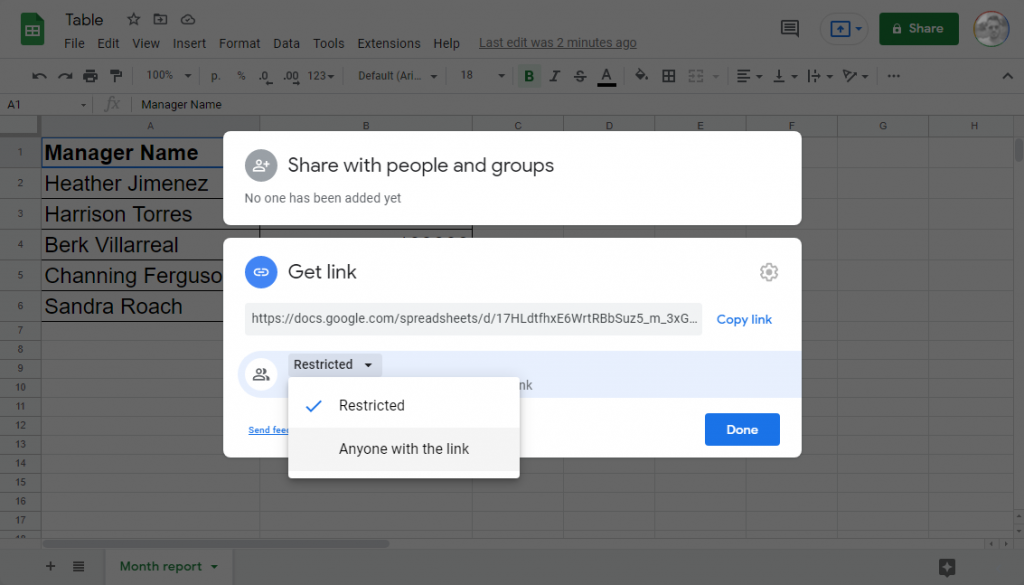
- Enable access to the document via a link. You can do it by clicking on the “Share” button and choosing “Anyone with the link”. (The “Viewer” access is enough.)
- Copy the ID of the document. It can be found in the document’s URL, between the “/spreadsheets/d/” and “/edit” parts. This ID will be required later in the JS code ({SPREADSHEET_ID}).

All the necessary settings on the Google side are completed. Let’s move on to an application.
Accessing Google Spreadsheet Data from JavaScript Applications
Now, I will explain how to create a simple JavaScript application that fetches the data from the spreadsheet and shows it to users. To connect the app to the Sheets API, I will use the Google API Client Library for JavaScript (aka gapi), which is well described in its GitHub repository.
1) Creating a basic JavaScript application
First of all, include the gapi library in your page using the direct link.
Add the <table> tag to the HTML code and apply the CSS code you like for the table and its future content.
In the JavaScript code, create a function that will be used for fetching the data.
const start = () => {};Inside that function, initialize the gapi client with your Google API key created earlier.
 gapi.client.init({
    'apiKey': '{GOOGLE_API_KEY}',
    'discoveryDocs': ["https://sheets.googleapis.com/$discovery/rest?version=v4"],
  })
Then execute a request to get values via the gapi client. In the request, you should provide the spreadsheet ID and the range of cells where the data you want to access is located.
.then(() => {
    return gapi.client.sheets.spreadsheets.values.get({
      spreadsheetId: '{SPREADSHEET_ID}',
      range: '{SHEET_NAME}!{DATA_RANGE}', // for example: List 1!A1:B6
    })
  })
If all settings are correct, the resolved promise returns a response with the fetched data. Now you can get the data from the response and populate the HTML table using a simple JS script.
.then((response) => {
    // parse the response data
    const loadedData = response.result.values;

    // populate the HTML table with the data
    const table = document.getElementsByTagName('table')[0];

    // add column headers
    const columnHeaders = document.createElement('tr');
    columnHeaders.innerHTML = `<th>${loadedData[0][0]}</th>
<th>${loadedData[0][1]}</th>`;
    table.appendChild(columnHeaders);

    // add table data rows
    for (let i = 1; i < loadedData.length; i++) {
      const tableRow = document.createElement('tr');
      tableRow.innerHTML = `<td>${loadedData[i][0]}</td>
<td>${loadedData[i][1]}</td>`;
      table.appendChild(tableRow);
    }
  }).catch((err) => {
  	console.log(err.error.message);
  });
To execute the code, call the load() function from the gapi library and pass the function created above as an argument.
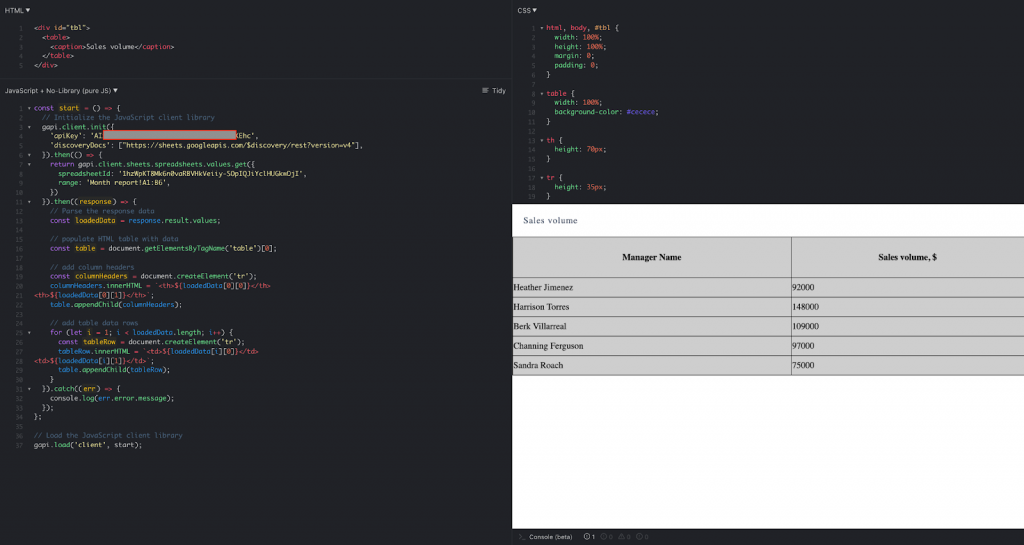
gapi.load('client', start);The resulting application looks like below. You are welcome to check out the full code template of this HTML table with data from Google Sheets on JSFiddle. To get your own thing like this working, just replace {GOOGLE_API_KEY}, {SPREADSHEET_ID}, {SHEET_NAME}, and {DATA_RANGE} with your own information (and don’t keep the braces).
2) Tinkering output — show the data as a chart
In real-world applications, simple HTML tables are usually not enough; we want to visualize and analyze the data. Let me show you how to create a dashboard that increases the readability of the data and brings us closer to the real-world use case. When I am on duty and asked for assistance with Google Sheets API integration, it is actually the first example I share, and basically, almost always the last as it’s very illustrative and no further help is needed.
So, let’s use the AnyChart JS library for data visualization. It includes column charts and pie charts, which would be enough for this simple dashboard.
Before anything else, add AnyChart’s base JS module to HTML:
<script src="https://cdn.anychart.com/releases/8.11.0/js/anychart-base.min.js"></script>Also, add <div> tags for dashboard containers and apply a suitable ID for each:
<div id="container1"></div>
<div id="container2"></div>
Most of the JavaScript code remains absolutely the same. I will just rework the code that handles the Sheets API response.
So, keep the first part of the JS code unchanged:
const start = () => {
  // Initialize the JavaScript client library
  gapi.client.init({
    'apiKey': '{GOOGLE_API_KEY}',
    'discoveryDocs': ["https://sheets.googleapis.com/$discovery/rest?version=v4"],
  }).then(() => {
    return gapi.client.sheets.spreadsheets.values.get({
      spreadsheetId: '{SPREADSHEET_ID}',
      range: '{SHEET_NAME}!{DATA_RANGE}', // for example: List 1!A1:B6
    })
  }).then((response) => {

In the response handler, parse the data to compose a structure compatible with the AnyChart API:

    const loadedData = response.result.values;
    const parsedData = {
      'header': loadedData.shift(),
      'rows': loadedData,
    };

Now we’ve got everything we need to create and configure charts for the dashboard:

    // create an instance of a column chart
    const columnChart = anychart.column();

    // set the data
    columnChart.data(parsedData);

    // configure chart appearance settings
    columnChart.title('Sales volume by manager');
    columnChart.xAxis().title('Manager');
    columnChart.yAxis().title('Sales volume, $');

    // set the container element and draw the chart
    columnChart.container('container1').draw();

    // create a pie chart likewise
    const pieChart = anychart.pie(parsedData);
    pieChart.title('Sales volume distribution in the department');
    pieChart.legend().itemsLayout('vertical').position('right');
    pieChart.container('container2').draw();

Then goes the same ending part as with the HTML table — let’s recall it just in case:

  }).catch((err) => {
  	console.log(err.error.message);
  });
};

// load the JavaScript client library
gapi.load('client', start);
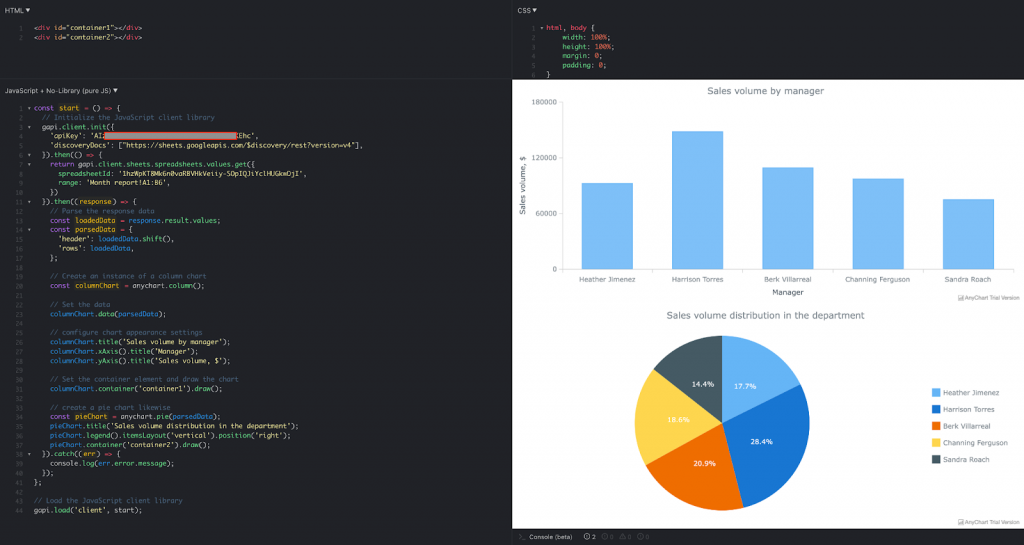
Below is what the resulting dashboard looks like. You can check out the full template code of this dashboard visualizing data from Google Sheets using the v4 API on JSFiddle. To get your own project like this, simply put your own information in place of {GOOGLE_API_KEY}, {SPREADSHEET_ID}, {SHEET_NAME}, and {DATA_RANGE} (and don’t keep the braces).
Epilogue and Links
I hope this article will be helpful to anyone who decides to build an app that uses data from Google Sheets and access it from JavaScript applications. If you have any further questions, please feel free to get in touch with me and I will be happy to do my best to help you out.
For your convenience, here is a list of all useful links from this article, in one place:
Prerequisites
- Google Sheets API: https://developers.google.com/sheets/api
- Google Sheets API migration guide: https://developers.google.com/sheets/api/guides/migration
- Google API JavaScript client: https://github.com/google/google-api-javascript-client/blob/master/docs/start.md
- Securing a key: https://cloud.google.com/docs/authentication/api-keys#securing_an_api_key
Integration examples
- HTML table template on JSFiddle: https://jsfiddle.net/7ngrfpxk/
- JavaScript dashboard template on JSFiddle: https://jsfiddle.net/82hn9dmL/
Frequently Asked Questions (FAQs) about Google Sheets API v4 Integration
What is the Google Sheets API v4 and how does it work?
Google Sheets API v4 is a service that allows developers to read, write, and manage data in Google Sheets. It works by enabling your application to interact with Google Sheets through a series of HTTP requests. These requests can be used to create, retrieve, update, or delete data in a Google Sheet. The API uses a RESTful architecture, meaning it is stateless and separates concerns, making it easy to scale and modify.
How do I get started with Google Sheets API v4?
To get started with Google Sheets API v4, you first need to create a project in the Google Cloud Console. After creating the project, enable the Google Sheets API for your project. Then, create credentials that your application will use to authenticate its requests. Once you have your credentials, you can start making requests to the API using the HTTP protocol.
How do I authenticate my application with the Google Sheets API v4?
Authenticating your application with the Google Sheets API v4 involves creating credentials in the Google Cloud Console. These credentials come in the form of a JSON file that contains a client ID and client secret. You use these credentials to obtain an access token, which your application includes in its API requests to authenticate itself.
How do I read data from a Google Sheet using the API?
Reading data from a Google Sheet using the API involves making a GET request to the API’s spreadsheets.values.get method. This method requires the ID of the sheet you want to read from and the range of cells you want to read. The API will return the data in those cells in the response to your request.
How do I write data to a Google Sheet using the API?
Writing data to a Google Sheet using the API involves making a PUT or POST request to the API’s spreadsheets.values.update or spreadsheets.values.append methods. These methods require the ID of the sheet you want to write to, the range of cells you want to write to, and the data you want to write. The API will write the data to the specified cells and return a response confirming the write operation.
How do I manage a Google Sheet using the API?
Managing a Google Sheet using the API involves making requests to various methods of the API. These methods allow you to create, delete, and update sheets, as well as manage the cells within a sheet. For example, you can use the spreadsheets.create method to create a new sheet, the spreadsheets.batchUpdate method to update multiple cells at once, and the spreadsheets.values.clear method to clear the data in a range of cells.
What are the limitations of the Google Sheets API v4?
The Google Sheets API v4 has several limitations. For example, it has a quota limit, which restricts the number of requests you can make per day. It also has a rate limit, which restricts the number of requests you can make per second. Additionally, the API does not support all the features of Google Sheets, such as conditional formatting and data validation.
How do I handle errors when using the Google Sheets API v4?
When using the Google Sheets API v4, errors can occur for various reasons, such as exceeding your quota or making an invalid request. When an error occurs, the API returns an error response that includes a status code and a message explaining the error. You can handle these errors in your application by checking the status code and message and taking appropriate action.
Can I use the Google Sheets API v4 with other Google APIs?
Yes, you can use the Google Sheets API v4 with other Google APIs. For example, you can use it with the Google Drive API to manage the files in your Google Drive, or with the Google Charts API to create charts from your data. To use the Google Sheets API with another Google API, you need to enable both APIs for your project in the Google Cloud Console.
How do I secure my data when using the Google Sheets API v4?
When using the Google Sheets API v4, you can secure your data by using HTTPS for your API requests and by restricting access to your Google Sheets. You can restrict access by setting permissions on your sheets and by using the OAuth 2.0 protocol to authenticate your application’s requests. Additionally, you can monitor your API usage and set alerts for unusual activity using the Google Cloud Console.
 Alexander Shestakov
Leading technical support at AnyChart for years, Alex has helped numerous developers and analysts build and integrate interactive data visualizations powered by its JavaScript charting libraries, Qlik extensions, and other tools. To feed a growing passion for coding, now he also does back end development for LIFE in the Air's in-flight entertainment software.