It’s been 15 years since Xdebug first came out. We think this is the perfect opportunity to re-introduce it to the world, and explain how and why it does what it does.

Xdebug is a PHP extension (meaning it needs to be compiled and installed into a PHP installation) which provides the developer with some features for debugging. Those include:
- stack traces – detailed output of the path the application took to reach a given error, including parameters passed to functions, in order to easily track the error down.
- a prettier
var_dumpoutput which produces color coded information and structured views, similar to VarDumper, along with a a super-globals dumper - a profiler for finding out where the bottlenecks in your code are, and the ability to visualize those performance graphs in external tools. What this results in is a graph similar to that which Blackfire produces.
- a remote debugger which can be used to remotely connect Xdebug with running code and an end-client like an IDE or a browser to step through breakpoints in code and execute line by line of your application.
- code coverage which tells you how much of your code was executed during a request. This is almost exclusively meant to help with unit tests and finding out how much of your code is test-covered.
How do I use it?
Xdebug comes with a detailed installation page which handles most if not all use cases, but if you’d like to play with the functionality presented below, we recommend using Homestead Improved which comes with the extension pre-installed and activated.
With modern IDEs and Blackfire, is there even a need for Xdebug?
IDEs do provide good code lookup functionality, so the link format functionality’s usefulness can seem questionable. There’s also loggers of all kinds now which can handle errors and exceptions. Likewise, function traces and profiling are done really well in Blackfire. However, file link formats are just one part of Xdebug, and using Blackfire has its own hurdles – installing the extension, setting up the keys, and then paying to keep trace history. Loggers also need to be used with a lot of foresight, and aren’t very easy to add into an application later on.
There’s more to Xdebug than just this, though – it’s still required for proper unit testing (testing frameworks depend on it for code coverage reports), it’s far from easy to get remote break-point debugging going via other means, and it’s a tool so old and stable it’s been ironed out to near perfection.
If your current tools can handle everything it offers or you don’t need the features it offers then of course, there’s no need for Xdebug, but I’ve yet to start a single project that could be completed just as efficiently without it.
Let’s Try It Out
I’ll assume you have a working Xdebug installation at this point. If not, please consider using Homestead Improved.
Let’s make a new project folder with a simple index.php file, and echo out a non-existent variable like $foo:
<?php

echo $foo;
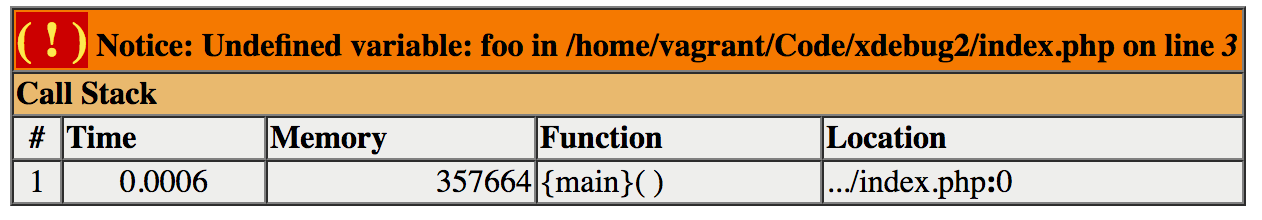
This is what we get:
Turning Xdebug Off
Screens like these are so ubiquitous these days, and such a common default, that most people don’t even realize this is already Xdebug-styled. To prove it, let’s see how it looks without Xdebug. To disable Xdebug, we edit the file /etc/php/7.1/fpm/conf.d/20-xdebug.ini in Homestead Improved, and comment out the first line:
;zend_extension=xdebug.so
xdebug.remote_enable = 1
xdebug.remote_connect_back = 1
xdebug.remote_port = 9000
xdebug.max_nesting_level = 512
We need to restart PHP-FPM afterwards:
sudo service php7.1-fpm restart
Note: if you’re using another development environment with a different PHP installation, your Xdebug ini file might be elsewhere. Consult your system’s documentation for the exact location, or ask in the comments below.

Looks quite barren, doesn’t it? It’s missing the whole call stack. Granted, this information isn’t particularly useful at this point since we’re only dealing with a single line in a single file, but we’ll look at a heavier use later on.
Reactivate Xdebug now by removing the comment in the previously edited file, and let’s continue. Don’t forget to restart PHP!
File Clickthroughs
If you’re a developer who’s fixed on an IDE (like I am on PhpStorm), it would definitely be useful to be able to click on files in the stack trace and go directly to them in the IDE. A non-trivial upgrade in debugging speed, for sure. I’ll demonstrate the implementation of this feature for PhpStorm.
First, let’s open the 20-xdebug.ini file we edited previously, and add the following to it:
xdebug.file_link_format = phpstorm://open?%f:%l
Note that this will work in some browsers, and won’t in others. For example, Opera has problems with phpstorm:// links and will gladly crash, while Firefox and Chrome work just fine.
If we refresh our invalid PHP page now, we’ll get clickable links which open the IDE at the precise location of the error:
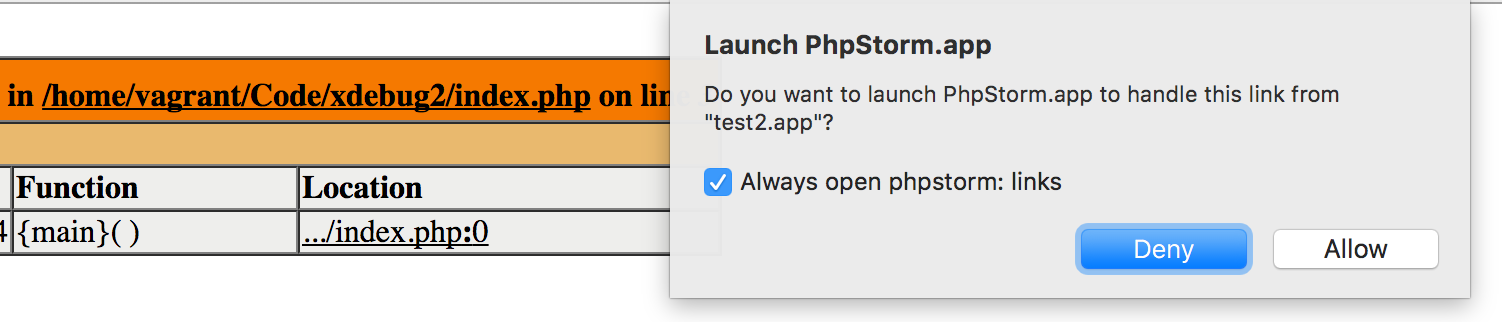
The process is the same for other IDEs and editors.
Xdebug with Vagrant and PhpStorm
Why stop at this, though? Many people today develop on virtual machines, making sure no part of the PHP runtime ever touches their main machine, keeping everything fast and smooth. How does Xdebug behave in those cases? Additionally, is it even possible to do break-point debugging where you step through your code and inspect each line separately when using such complex environments?
Luckily, Xdebug supports break-point-powered remote connections perfectly. We’ve covered the process before, so for a full gif-powered setup tutorial, please follow this guide.
Using the Profiler
As a final quick tip, let’s inspect one of the often neglected features: the profiler. For that, we’ll need a heavy application like Laravel.
composer create-project --prefer-dist laravel/laravel xdebug
Once again, we need to edit the 20-xdebug.ini file, and add the following:
xdebug.profiler_enable_trigger = 1
xdebug.profiler_output_dir = /home/vagrant/Code/
Note that we’re not using xdebug.profiler_enable = 1 because we don’t want it to stay on 100% of the time. Instead, we’ll use the trigger query param “XDEBUG_PROFILE” to selectively activate it. We’re also outputting the cachegrind profile into the main shared folder of our VM so that we can inspect it with tools on the host operating system.
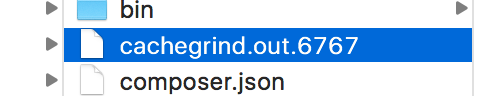
After restarting PHP, we can try it out by executing homestead.app/?XDEBUG_PROFILE (replace homestead.app with whichever vhost you picked, or the VM’s IP). Sure enough, the file is there:
Every OS will have its own cachegrind inspector tool, and on OS X one of those is qcachegrind, easily installed via Homebrew. Refer to your OS’s preferred visualizer for installation instructions. After installing it…
brew install qcachegrind --with-graphviz
… and opening the file in the viewer, we can see a nice breakdown of the execution flow:
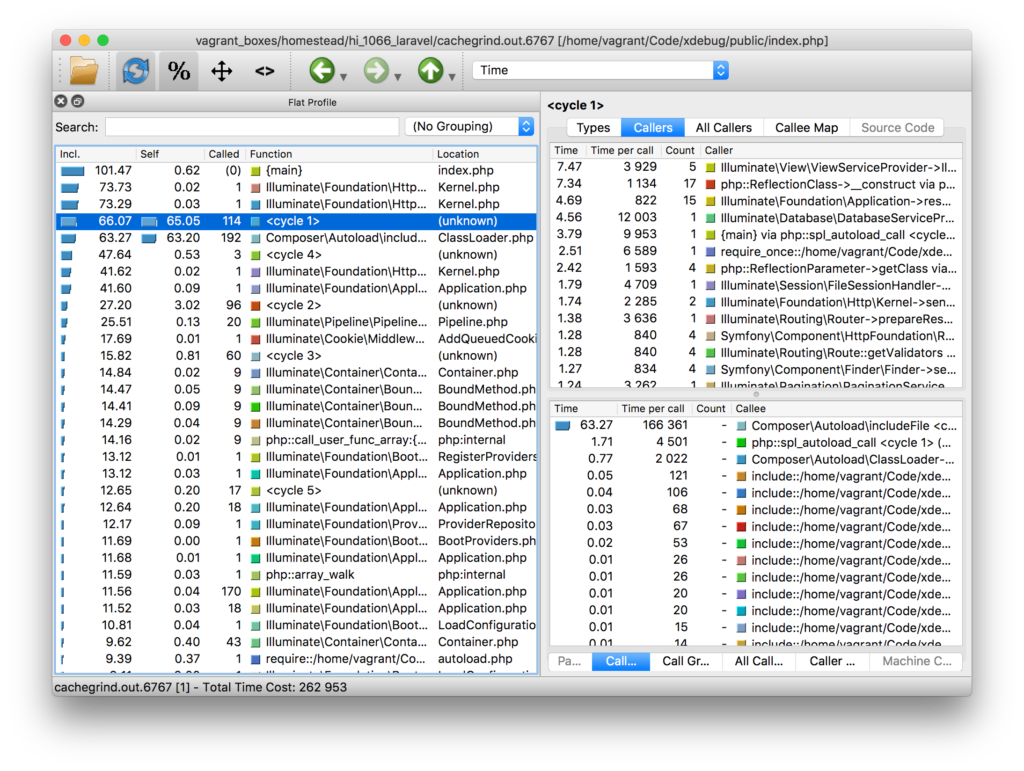
The profiler offers and immeasurable wealth of data and truly deep insight into the way your code behaves, just like Blackfire. With the profiler’s local output, however, it’s easier than ever to automate the continuous tracking of performance and execution complexity.
Forcing Xdebug’s Render on Laravel
By default, Laravel has custom error reports and rendering set up. An error like the one we caused before with an undefined variable would, in Laravel, look like this:
<?php

use Illuminate\Http\Request;

Route::get('/', function(Request $request){
    echo $foo;
    return view('welcome');
});
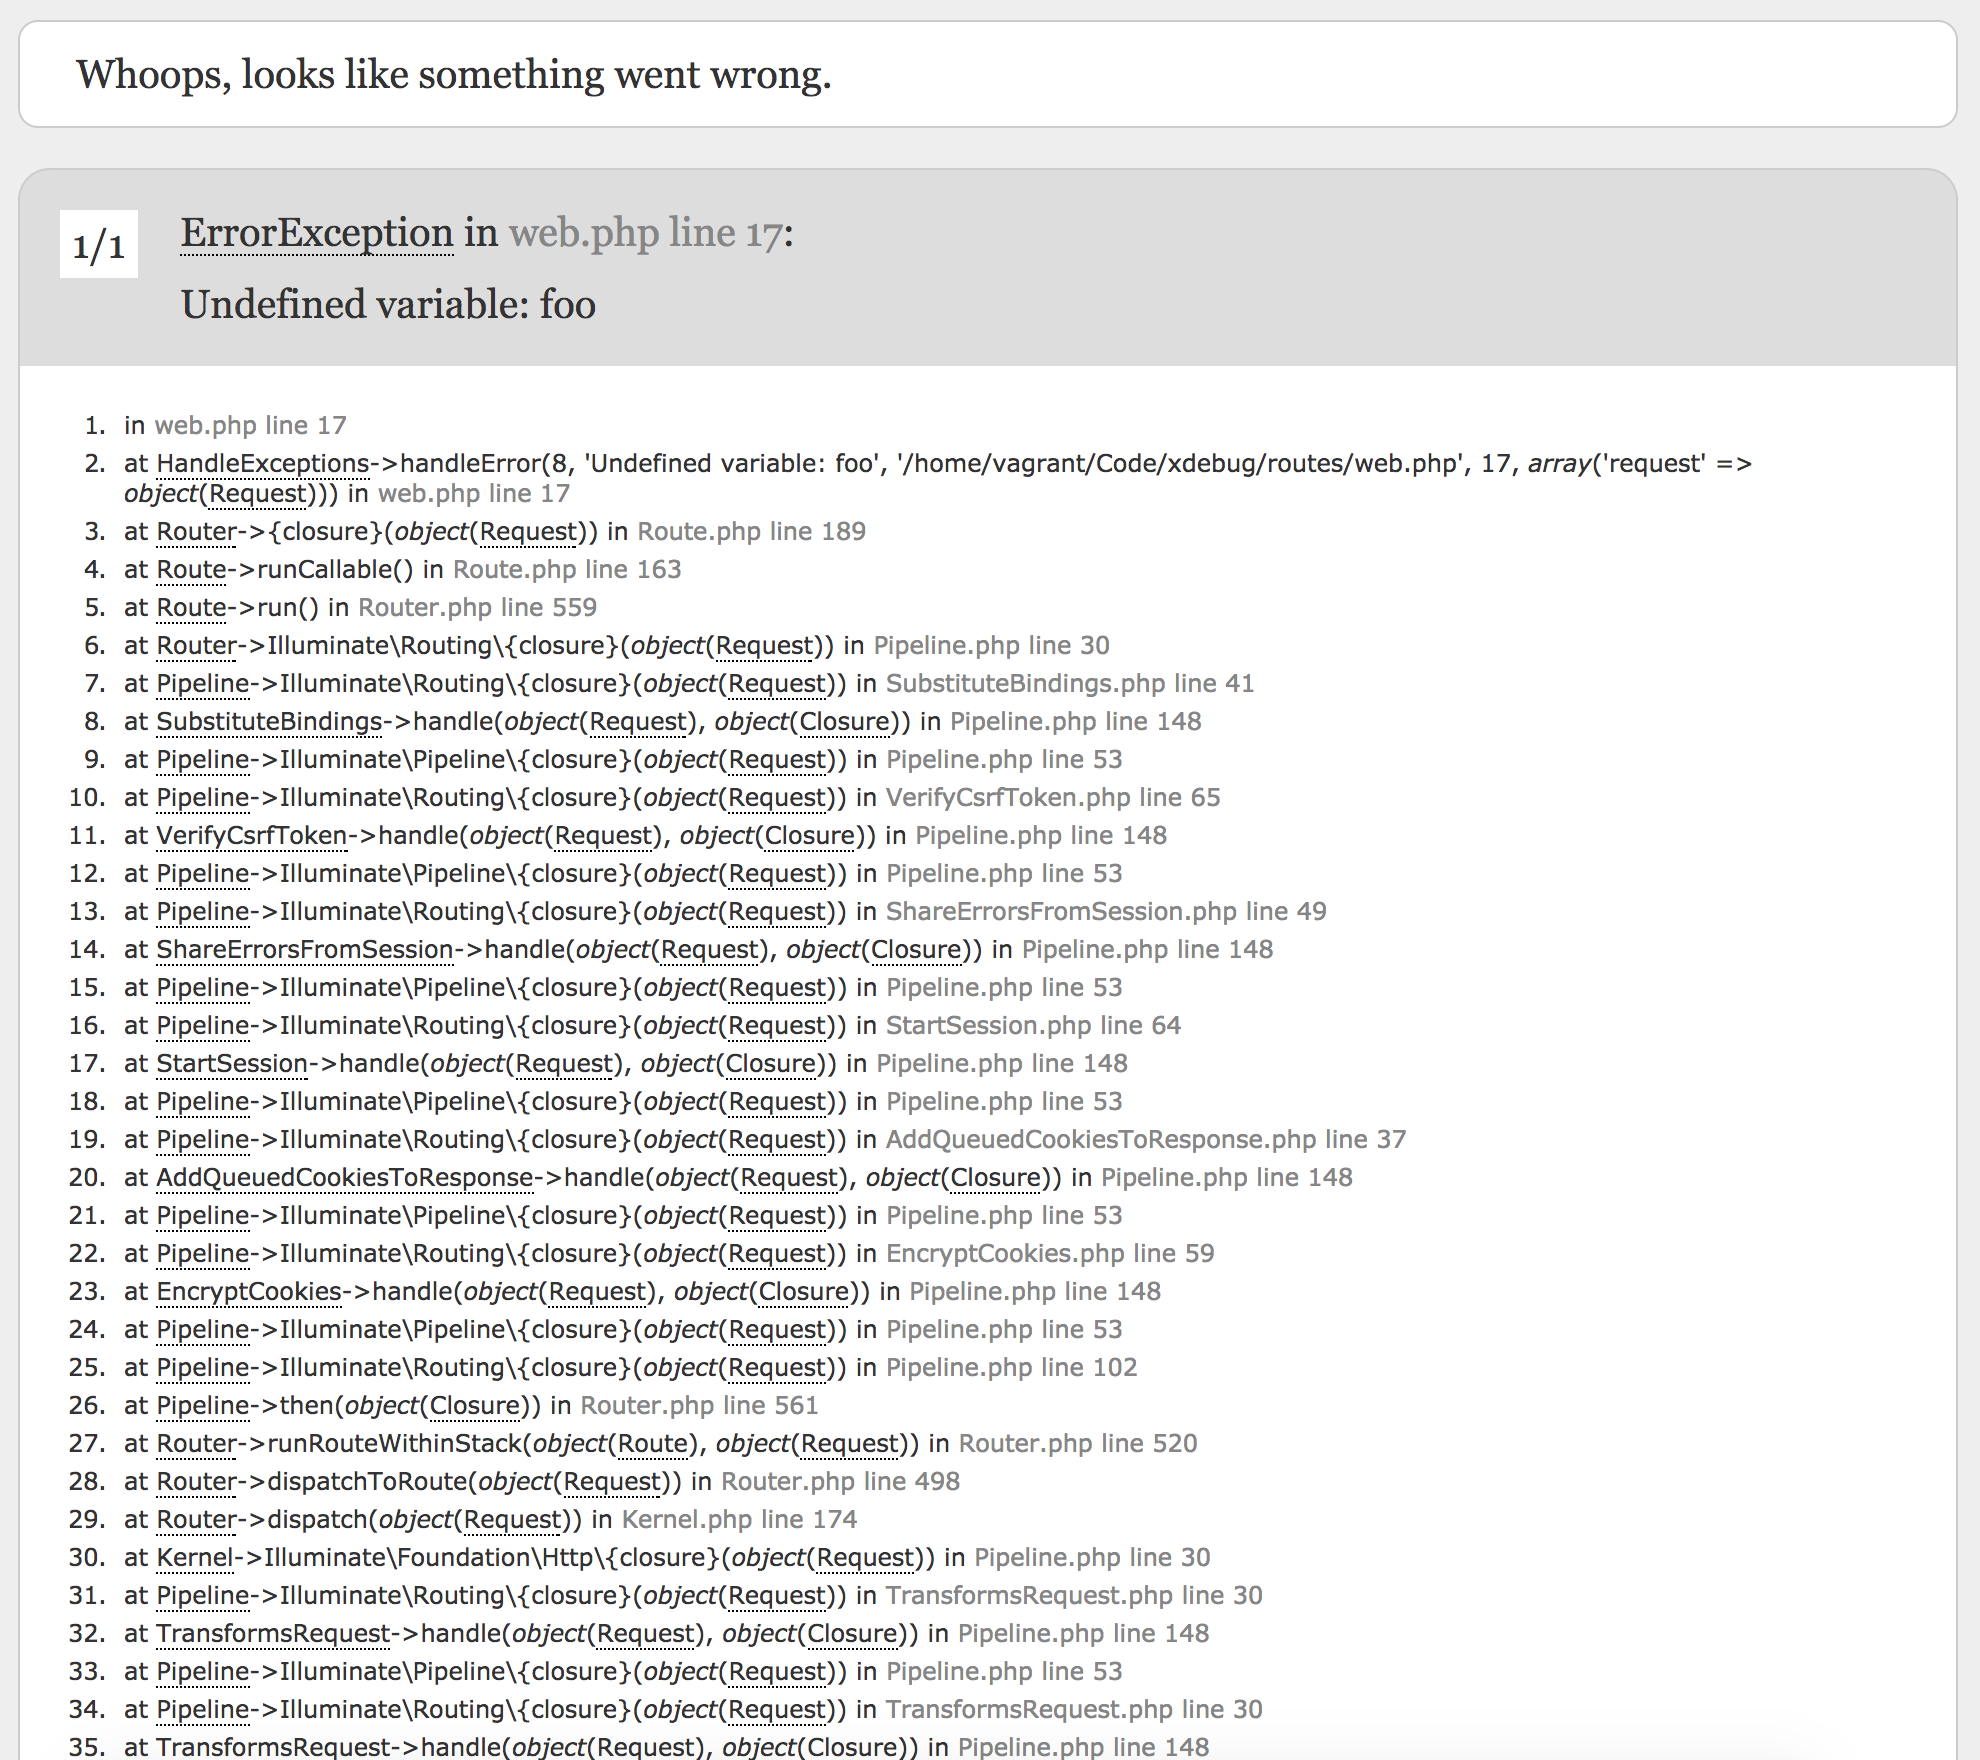
While Symfony’s error screen (which is what Laravel is using here) is configured to also play nice with Xdebug’s clickthrough (try it, you can now click on these files and their lines, too!), I really miss the memory output (Xdebug by default also outputs the memory usage at every point in time in the stacktrace). Let’s revert this to Xdebug’s screen while in development mode, so we can inspect that attribute.
<?php
use Illuminate\Http\Request;

Route::get('/', function(Request $request){
    ini_set('display_errors', 1);
    restore_error_handler();
    echo $foo;
    return view('welcome');
});
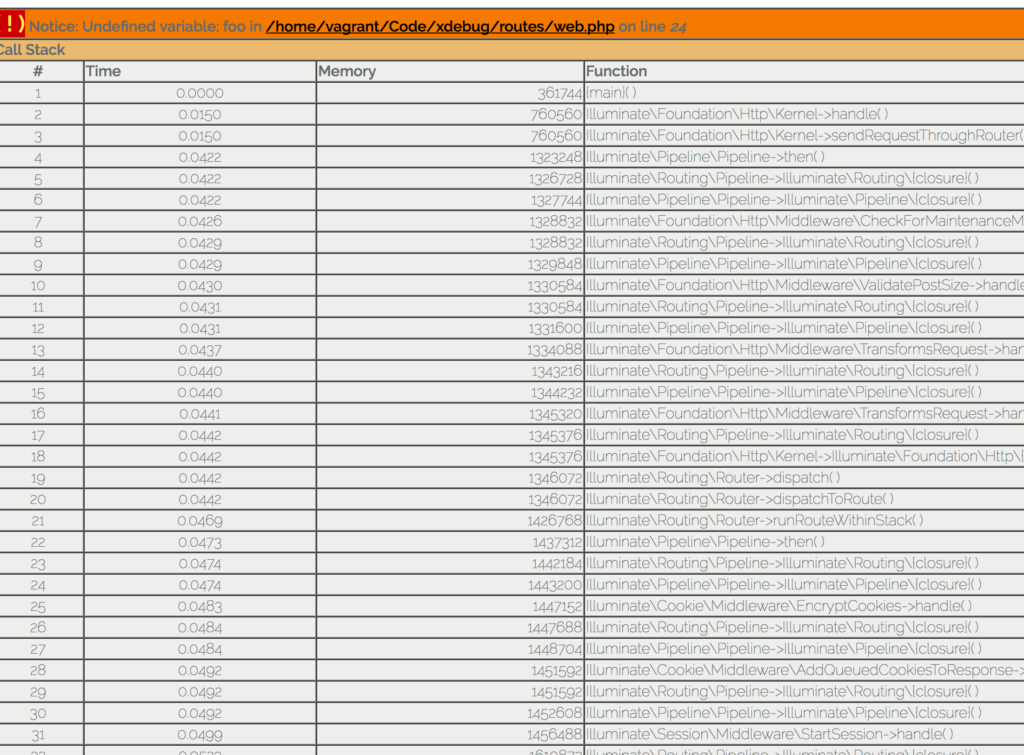
You can see here we updated our default route so that it first activates the displaying of errors (the screen we saw earlier is not a shown error per-se, but a caught exception the stack trace of which was manually extracted and rendered), and then we restore the error handler to its default value, overriding Laravel’s.
After refreshing, sure enough, our old screen is back – just look at that stack trace tower and memory consumption!
I encourage you to investigate further on your own – look around in the docs, play with the options, see what you can find out about your applications.
Conclusion
Xdebug is a valuable tool for any developer’s toolbelt. It’s a powerful extension that fully lives up to the word, extending the language we work in daily to be more verbose, more user friendly, and less mysterious when errors appear.
With 15 whole years behind it, Xdebug has set a high standard for debugging tools. I’d like to thank Derick for developing and maintaining it all this time, and I’d love it if you chose to write a tutorial or two about in-depth usage, caveats, or secret feature combinations no one’s thought of before. Let’s spread the word and help it thrive for another 15 years.
Happy birthday, Xdebug!
Frequently Asked Questions (FAQs) about Xdebug
How do I install and configure Xdebug for PHP development?
Xdebug is a powerful debugging tool for PHP. To install it, you need to download the appropriate version from the official Xdebug website. After downloading, you need to add it to your php.ini file. The configuration process may vary depending on your operating system and the PHP version you are using. Once installed and configured, you can use Xdebug to step through your code, inspect variables, and much more.
Why is my var_dump output unformatted when using Xdebug?
Xdebug modifies the var_dump function to display variables in a more readable format. However, if your var_dump output is unformatted, it could be due to several reasons. One common reason is that Xdebug is not properly installed or configured. Another reason could be that your HTML is interfering with the var_dump output. To solve this, you can wrap your var_dump call in pre tags to preserve the formatting.
How can I use Xdebug with my IDE?
Xdebug can be integrated with many popular IDEs such as PhpStorm, NetBeans, and Visual Studio Code. The process involves configuring your IDE to listen for Xdebug connections and setting up path mappings between your local source code and the server. Once set up, you can use your IDE to set breakpoints, step through your code, inspect variables, and more.
Why is Xdebug not working with var_dump?
If Xdebug is not working with var_dump, it could be due to several reasons. One common reason is that Xdebug is not properly installed or configured. Another reason could be that your PHP version is not compatible with the Xdebug version you are using. You can check your Xdebug and PHP versions by calling phpinfo() in your script.
How can I improve the performance of Xdebug?
While Xdebug is a powerful tool, it can slow down your application due to the overhead of debugging. To improve performance, you can disable Xdebug when you are not debugging. You can also configure Xdebug to only trigger when a specific GET/POST variable is set. This allows you to control when Xdebug is active and when it is not.
How can I use Xdebug to profile my PHP code?
Xdebug provides a profiling function that allows you to find bottlenecks in your code. To use it, you need to enable profiling in your php.ini file and specify a directory where the profiling output should be saved. The output can then be analyzed with tools like KCacheGrind or QCacheGrind.
How can I debug remote PHP code with Xdebug?
Xdebug supports remote debugging by communicating with your IDE over a network connection. To set up remote debugging, you need to configure Xdebug and your IDE to communicate with each other. This involves setting up a DBGp proxy and configuring your IDE to listen for Xdebug connections.
How can I use Xdebug to trace PHP execution?
Xdebug provides a tracing function that allows you to log all function calls, including parameters and return values. To use it, you need to enable tracing in your php.ini file and specify a directory where the trace output should be saved. The output can then be analyzed to understand the flow of execution in your code.
Why is my Xdebug not stopping at breakpoints?
If Xdebug is not stopping at breakpoints, it could be due to several reasons. One common reason is that your IDE is not properly configured to listen for Xdebug connections. Another reason could be that your path mappings are not correctly set up. You should check your IDE and Xdebug configurations to ensure they are correct.
How can I use Xdebug with Docker?
Xdebug can be used with Docker by installing it in your Docker PHP container. You need to add the necessary commands to your Dockerfile to install Xdebug and configure it. Once installed, you can configure your IDE to connect to Xdebug in the Docker container.
 Bruno Skvorc
Bruno is a blockchain developer and technical educator at the Web3 Foundation, the foundation that's building the next generation of the free people's internet. He runs two newsletters you should subscribe to if you're interested in Web3.0: Dot Leap covers ecosystem and tech development of Web3, and NFT Review covers the evolution of the non-fungible token (digital collectibles) ecosystem inside this emerging new web. His current passion project is RMRK.app, the most advanced NFT system in the world, which allows NFTs to own other NFTs, NFTs to react to emotion, NFTs to be governed democratically, and NFTs to be multiple things at once.