When you deploy an app to production servers, you may experience some database problems as your data grows. Some tools can help you debug and solve your problems, like MysqlTuner, Percona, etc. In this article, we’re going to explore the Yahoo MySql performance analyzer and see what the main features are.

Installation
The analyzer uses SNMP when available, so it’s a good idea to have it installed on your database server.
Because this is a JAVA application, make sure you have JDK installed before proceeding. It requires version 8 to run, but version 7 is fine since it doesn’t use any of version 8’s features. You can read more in the readme file in the repo.
I have a demo application on my Vagrant box, and I will install the analyzer in the root of my application. Let’s start by logging into our machine using ssh and cloning the repository.
vagrant ssh
git clone git@github.com:yahoo/mysql_perf_analyzer.git myperf
To build the application, you need to run the mvn clean package command. After the build process is done, you’ll find a myperfserver-server.zip file under the perfJettyServer/target directory. Move that file to a new directory on your server and extract it. The resulting output contains start_myperf.sh and stop_myperf.sh scripts to manage the server. Let’s use the start script to launch the application. You can read more about the available options in the repo.
Managing Users
After starting the server, open your browser using your machine hostname and the specified port (vaprobash.dev:9092/myperf). You can log in with the default admin account (username: myperf, password: change).
The users management page can be accessed from the top left menu. It allows you to add, edit, delete and confirm users, and you can use it to change the default admin password.

Dashboard
The main dashboard shows the current status of your databases along with other details like CPU usage, running threads, dead locks, etc.
The second tab on the dashboard shows alerts from the last 24 hours. We will talk more about alerts and how to configure them later.
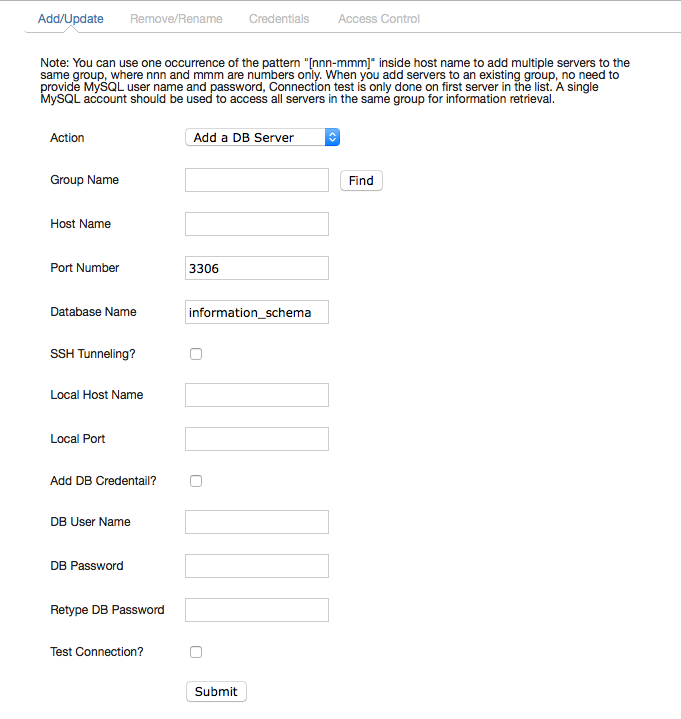
Configuring DB Groups
To monitor a database or a set of databases, you can create a new database group from the top left menu and select DB Info. After filling the inputs you can visit the dashboard to see your databases status. You can restrict the database access to a certain group of users using the Access Control tab.
Monitoring Processes
You can do real time monitoring of your system resources by accessing the Top page from the menu. If you ever used the top command on linux, this basically does the same thing for your databases. It shows your memory, CPU usage, DB connections, network transfers, etc. You can start and stop the process at any time using controls at the top of the page.
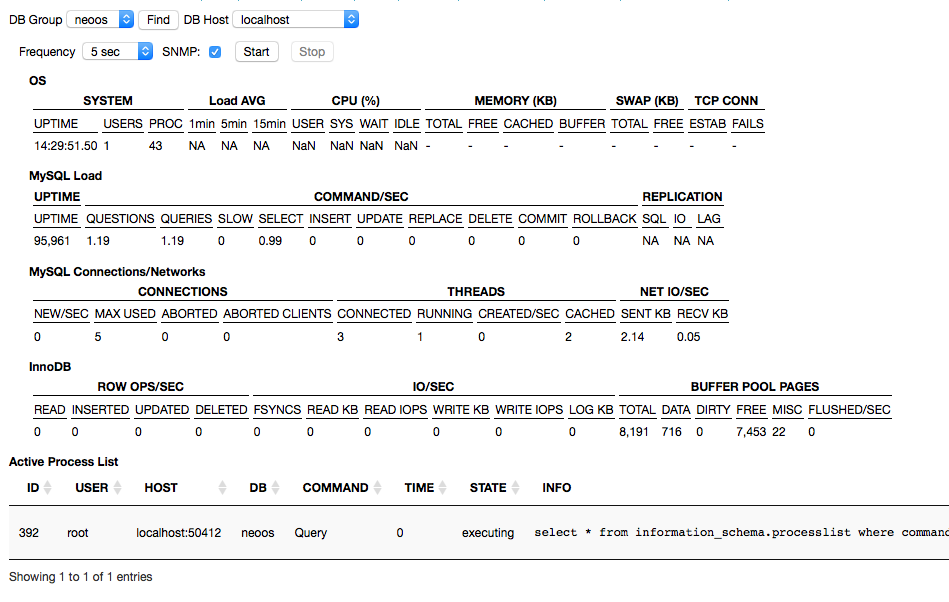
You can also use the SNMP program when available, but check the box to enable it before starting the process.
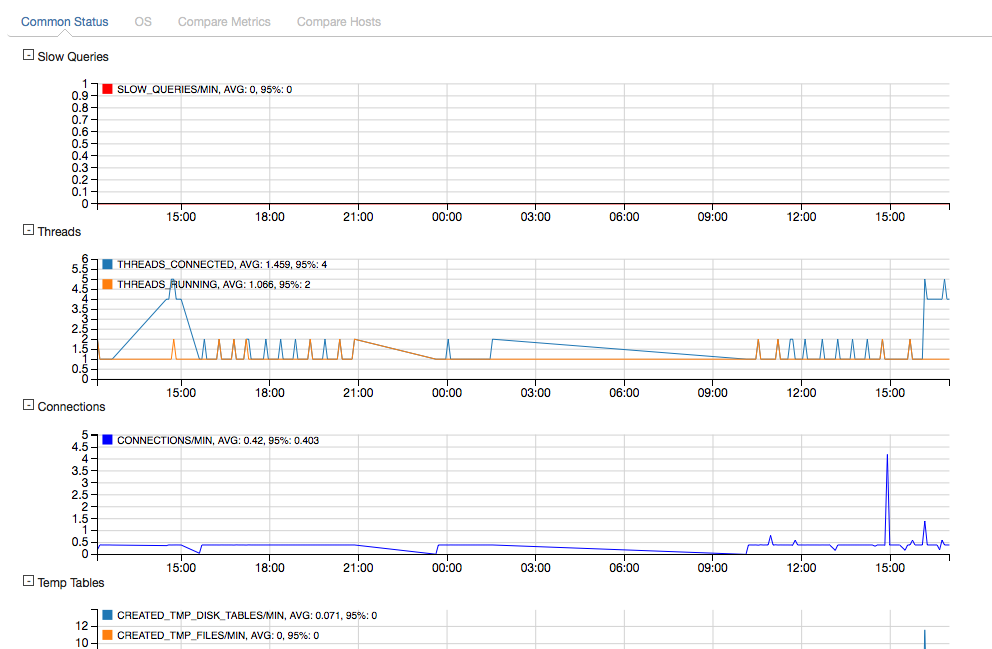
Charting
If you’re a reporting fan and you prefer working with charts to compare your database server performance over time, the charts tab provides a charting tool along with date range selection to help you understand your server performance. You can also compare different server metrics like memory usage, DB connections, etc.
Exploring Database Meta Data
Although we are used to exploring database meta data from our database management apps like SequelPro, Yahoo performance analyzer provides a simple way to explore database and table meta data, like columns, views, indexes, triggers, etc.
Explaining Queries
Probably the most used feature in performance analysis is Profiling Queries, since it helps a lot in detecting slow queries and explaining them. It also shows data about memory usage, execution time, cache usage, etc.
Alerts
Alerts are an indispensable feature in monitoring your database performance. Basically, you set a rule that defines when your system is (or will be) experiencing problems.
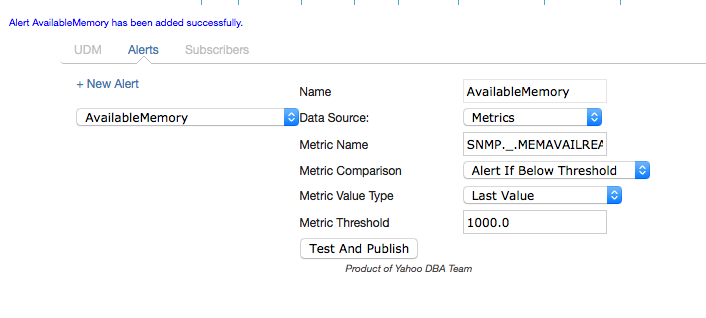
From the User Defined Alerts menu at top of the page, you can create an alert using predefined metrics. As an example, I will use the SNMP._.MEMAVAILREAL metric, which defines the available memory and I will set the alert to trigger if it went below 1000KB.
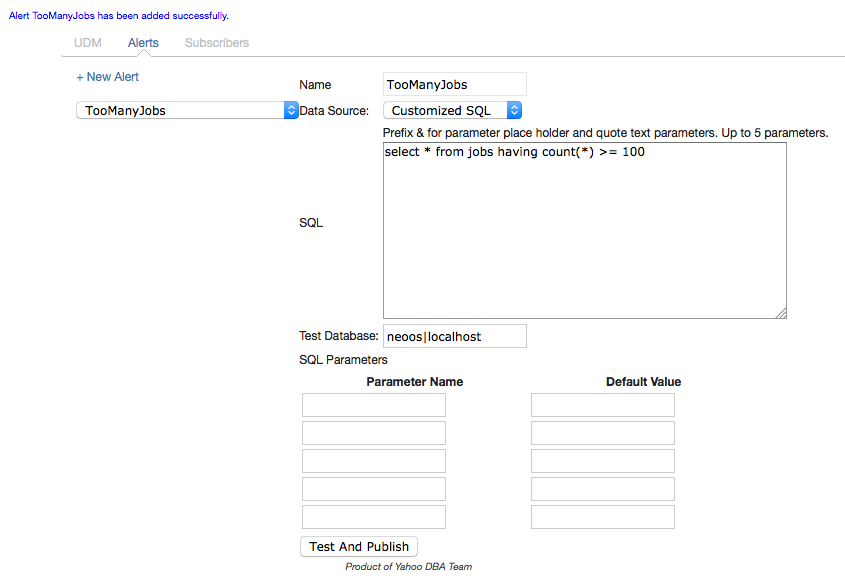
You can also create alerts based on a database query. We can create an alert to trigger when the list of queued jobs is higher than 100.
After creating your alerts, you need to move to the subscribers tab on the same page and select your DB Group and check alerts that you want to attach.
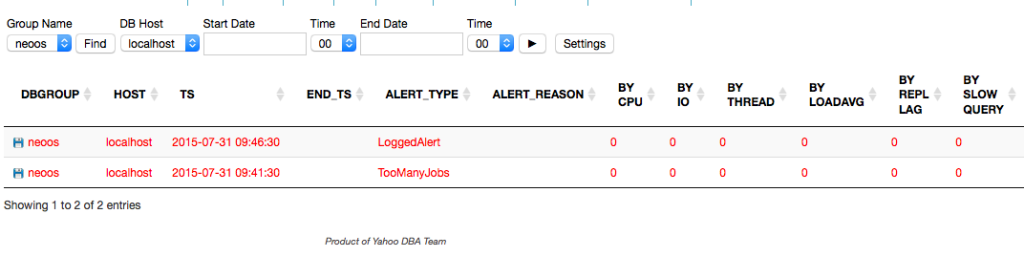
Now, if you navigate to the Alerts page, you’ll find a list of errors from the last 24 hours, and you can select a date range to see previously occurred errors.
Conclusion
This article was a brief introduction to the main features of the Yahoo performance analyzer, and there’s still a lot to discover. The project is still being developed – you can contribute on Github.
A more advanced post covering the analyzer’s usage on a real database is coming soon!
If you have any question or comments, please post them below.
Frequently Asked Questions (FAQs) about Yahoo’s MySQL Performance Analyzer
How does Yahoo’s MySQL Performance Analyzer differ from other performance analyzers?
Yahoo’s MySQL Performance Analyzer is a unique tool that provides a comprehensive analysis of your MySQL database performance. Unlike other performance analyzers, it offers a user-friendly interface that allows you to easily navigate through your database’s performance metrics. It also provides real-time monitoring and detailed reports, which can help you identify and resolve performance issues more efficiently. Furthermore, it supports a wide range of MySQL versions, making it a versatile tool for different MySQL users.
Can Yahoo’s MySQL Performance Analyzer be used with other databases?
Yahoo’s MySQL Performance Analyzer is specifically designed for MySQL databases. It may not work effectively with other types of databases. However, its comprehensive features and user-friendly interface make it an excellent tool for analyzing and optimizing MySQL database performance.
How does Yahoo’s MySQL Performance Analyzer help in optimizing database performance?
Yahoo’s MySQL Performance Analyzer provides detailed reports on your database’s performance metrics. These reports can help you identify potential performance issues, such as slow queries or inefficient indexing. By addressing these issues, you can optimize your database performance and ensure that your applications run smoothly.
Is Yahoo’s MySQL Performance Analyzer suitable for large databases?
Yes, Yahoo’s MySQL Performance Analyzer is capable of handling large databases. It provides real-time monitoring and detailed reports, which can help you manage and optimize your database performance effectively, regardless of its size.
How user-friendly is Yahoo’s MySQL Performance Analyzer compared to other tools?
Yahoo’s MySQL Performance Analyzer is known for its user-friendly interface. It provides a clear and intuitive layout that allows you to easily navigate through your database’s performance metrics. This makes it easier for you to identify and resolve performance issues, compared to other tools that may have more complex interfaces.
Does Yahoo’s MySQL Performance Analyzer provide real-time monitoring?
Yes, Yahoo’s MySQL Performance Analyzer provides real-time monitoring of your database’s performance. This allows you to identify and address performance issues as they occur, ensuring that your database operates at its optimal efficiency.
Can Yahoo’s MySQL Performance Analyzer identify slow queries?
Yes, Yahoo’s MySQL Performance Analyzer can identify slow queries in your database. It provides detailed reports on your database’s performance metrics, including query execution times. This can help you identify slow queries and optimize them for better performance.
Does Yahoo’s MySQL Performance Analyzer support all versions of MySQL?
Yahoo’s MySQL Performance Analyzer supports a wide range of MySQL versions. This makes it a versatile tool for different MySQL users, regardless of the version they are using.
How does Yahoo’s MySQL Performance Analyzer compare to IBM’s Application Performance Analyzer?
While both tools provide comprehensive performance analysis, Yahoo’s MySQL Performance Analyzer is specifically designed for MySQL databases. It offers a user-friendly interface and supports a wide range of MySQL versions. On the other hand, IBM’s Application Performance Analyzer is a more general tool that can be used with various types of applications and databases.
Is Yahoo’s MySQL Performance Analyzer a free tool?
Yahoo’s MySQL Performance Analyzer is a commercial product. However, it offers a free trial that allows you to test its features before deciding to purchase the full version.
 Younes Rafie
Younes is a freelance web developer, technical writer and a blogger from Morocco. He's worked with JAVA, J2EE, JavaScript, etc., but his language of choice is PHP. You can learn more about him on his website.