 Today, I want to talk about code metrics. Taking the time to critically analyze your code can provide a number of wonderful benefits. It provides a viewpoint through which you can identify problem areas in your code base. It can give you confidence that you are reaching your goals and confirm suspicions when you are floundering. However, in my experience the best benefit of using code metrics is gaining insight into you and your team’s coding style.
Now that we’ve established some of the benefits of code metrics, let’s talk about some of the pitfalls. Unfortunately, like so many other things in the software development world, code metrics are not the only solution. Measuring productivity by any code metric will result in programmers coding to the metric. For example, if that metric is test coverage, they’ll write a single test that runs an assertion against every file. It may not be as blatant as that, but if you structure any incentives around these metrics, they will be gamed.
Another common pitfall is to assume that these metrics actually mean something. Metrics can provide you with insight, but to make that insight actionable, you’ll have to take thoughtful steps to ensure that there is in fact a problem. Once you’ve decided that there is a problem, you’ll need to see if that problem is worth fixing. One last thing, these are never fire and forget tools. They require cogitation, time, and effort in order to be useful.
In this article I’ll walk through three of the most common code metrics. We’ll first talk about cyclomatic complexity, then about the ABC metric, finally we’ll move on to test coverage. For each of these, I’ll explain what they are in as much detail as this format allows and walk through tools you can use immediately to test your own code. Alright, here we go…
Today, I want to talk about code metrics. Taking the time to critically analyze your code can provide a number of wonderful benefits. It provides a viewpoint through which you can identify problem areas in your code base. It can give you confidence that you are reaching your goals and confirm suspicions when you are floundering. However, in my experience the best benefit of using code metrics is gaining insight into you and your team’s coding style.
Now that we’ve established some of the benefits of code metrics, let’s talk about some of the pitfalls. Unfortunately, like so many other things in the software development world, code metrics are not the only solution. Measuring productivity by any code metric will result in programmers coding to the metric. For example, if that metric is test coverage, they’ll write a single test that runs an assertion against every file. It may not be as blatant as that, but if you structure any incentives around these metrics, they will be gamed.
Another common pitfall is to assume that these metrics actually mean something. Metrics can provide you with insight, but to make that insight actionable, you’ll have to take thoughtful steps to ensure that there is in fact a problem. Once you’ve decided that there is a problem, you’ll need to see if that problem is worth fixing. One last thing, these are never fire and forget tools. They require cogitation, time, and effort in order to be useful.
In this article I’ll walk through three of the most common code metrics. We’ll first talk about cyclomatic complexity, then about the ABC metric, finally we’ll move on to test coverage. For each of these, I’ll explain what they are in as much detail as this format allows and walk through tools you can use immediately to test your own code. Alright, here we go…
Cyclomatic Complexity
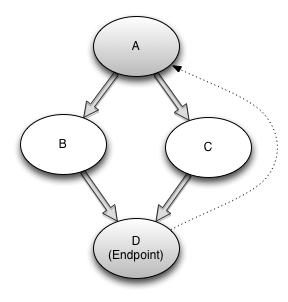
Cyclomatic complexity is a graphical measurement of the number of possible paths through the normal flow of a program.[1] For example, a program with no branching statements has a score of one. Calculation of the cyclomatic complexity of a method is done through the use of a control flow graph. These graphs consist of nodes and edges. Each node in a program represents a basic statement and each edge represents the changes in control flow of the program. This all sounds very difficult to grasp, so let’s look at an example. Given this piece of Ruby:def cyclomatic_complexity_of_two(arg)
if arg # Node A
puts "Foo" # Node B
else
puts "Bar" # Node C
end
end # Node Dif arg line represents a node, as do our puts "Foo" and puts "Bar" lines, and our endpoint. Finally our edges are from:
- A to B
- A to C
- B to D
- C to D
- And our endpoint back to our entrypoint (virtual edge)
Edges - Nodes + Endpoints[2]. A plot of the above method looks like this:
 If you want to know more about cyclomatic complexity read this paper by Arthur Watson and Thomas McCabe.
The Advantages
The advantages of keeping this number low are clear. A high cyclomatic complexity signals that the code may be difficult to follow. It also tends to mean that the code is harder to test and debug. Keeping this score low, can ensure that you and your team will be better able to understand what’s happening and make smart decisions.Getting started with CC
Our first stop in Ruby land is Saikuro. It’s a program used to measure the cyclomatic complexity of your program. You can download it here, and then runruby setup.rb all. Alternatively, you could install by: gem install atoulme-Saikuro, which is a clone of the main Saikuro repository. I find the latter a little more convenient (and not as old school).
Once you’ve done that you can run your first Saikuro report with the following command. Since it generates an html (or text) report, I reccommend making a directory for the output and sending it there. Otherwise, the default is to place the reports into your current directory.
~$ mkdir ./saikuro_output
~$ saikuro -c -o saikuro_output -p euclid_equation.rb
~$ open ./saikuro_output/index_cyclo.htmlsaikuro -h, the above command tells Saikuro to create a report of the:
- Cyclomatic complexity (
-c) - Output directory (
-o) - And parse (
-p) this file.
For example, invoking the “each” method of an array with a block would only traverse the given block if the array is not empty.[3]Saikuro also ignores the operators
&& and and, though in a perfect world these would add to the cyclomatic complexity.
You can have it report recursively on a dir or target a troublesome class. If you want to take more control over your usage of Saikuro, you can use the gem version and: SaikuroRunner.new.run(rb_files, output_dir).
So there you have it, a quick reporting tool that can help you understand where you have excess complexity in your projects. In a moment, we’ll see how this is somewhat similar to another project that is great for code evaluation – Flog.
ABC Metric
Luckily there are a few papers[4] on the ABC metric that have been searched enough to actually make this google-able. ::grumble:: Anyway, the ABC metric is another way to measure complexity, though its originator vociferously claims that it is a measurement of the size of the program, similar to LoC. Either way, it is certainly a method for better understanding where your code may have issues. The ABC method is a method by which scores are gathered for each component- assignment, branching, and calls- then calculated into a score that can be easily understood. The formula is<a,b,c> until you want the total, then it is calculated into scalar format.
The Advantages
The ABC metric is a neat measurement because it let’s you sum up a lot of information in a way that is very easily understood. Since this information is easily understood, it’s easy to use it for a whole code base. If you understand how these numbers are forumlated, you can use them to cast a really bright spotlight on problem areas in your code base. Let’s move straight into the Getting Started section because we get to use Flog.Getting Started with ABC
Alright, so the tool we are going to talk about is Flog. It’s a tool that has been in widespread use for a long time, so in all likelihood you’ve heard of it or have even potentially used it. As such, I won’t spend too much time on installation, justgem install flog and you’re off to the races.
The first thing about Flog that you need to know is that it’s opinionated. Very opinionated. The scoring is custom built to apply commonly accepted design patterns for Ruby. In this way, we need to think of Flog as using a modified ABC metric. For example, using inject humorously (if a little snarkily) nets you two points.
Branching terms are :and, :case, :else, :if, :or, :rescue, :until, :when, :while. There are other rules that add to the branch total, but this is a good start. Assignment is pretty simple, add one to the score per assignment. Calls are any method call that takes the flow out of the current scope.
In a talk[5] Jake Scruggs (Author of metric_fu) gave back in 2008, he neatly summarized the rule of thumb that I like to remember when using Flog:
- 0-10 – Awesome. But does it do anything?
- 11-21 – Good.
- 21-40 – Might need to refactor.
- 41-60 – You could possibly justify the code. (i.e. cost of refactor prevents action)
- 61-? – Danger, investigate when possible.
# euclids_equation.rb

def gcd(x, y)
  while y != 0
    r = x % y
    x = y
    y = r
  end
  x
endflog ./euclids_equation.rb. And we get the output:
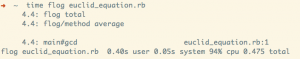 As you can see this method receives a 4.4. The default summary also shows a method average; if there were more methods, this would reflect the average complexity of each method. Flog has many options including parsing support for both 1.8 and 1.9 syntax. As you can see, the code executes quite speedily which makes it perfect for a githook.
A pre-commit hook that checks code complexity and returns non-zero for any score higher than 61 works quite well. And since you can always bypass with
As you can see this method receives a 4.4. The default summary also shows a method average; if there were more methods, this would reflect the average complexity of each method. Flog has many options including parsing support for both 1.8 and 1.9 syntax. As you can see, the code executes quite speedily which makes it perfect for a githook.
A pre-commit hook that checks code complexity and returns non-zero for any score higher than 61 works quite well. And since you can always bypass with --no-verify, it won’t prevent you from your normal workflow if you don’t want to bother.
Now that you’ve got your footing with Flog, let’s talk about coverage.
Code Coverage
Code coverage is a measure used in software testing. It describes the degree to which the source code of a program has been tested.[6]This seems a simple concept, but has surprising depth. Also, the terms used to describe the types of coverage are difficult to research and disambiguate. Before we go much further, I’ll describe a few terms that you’ll be expected to know if you want to dive into measuring code coverage in your projects.
- C1 coverage – This is basic statement coverage (also what simplecov uses). One of the most basic measurements. Simply measures that each statement is executed (or at least loaded) through tests.
- C2 coverage – This is branch coverage. Measures that there is a test for each edge of the flow.
simplecov, so I won’t belabour the point anymore. But know that there are many ways to define test coverage.
The Advantages
The advantages of tracking code test coverage is pretty obvious. You’ll be able to look at which areas in your code base are the most secure, and which are in most need of attention. A word of warning: Code coverage as mentioned earlier, can be gamed with relative ease. Be sure to use this only to give you an idea of where you stand and don’t build incentives around it. As always with code metrics, use thoughtful discretion when trying to gain actionable insight into your programs.Getting Started with Coverage
As briefly mentioned before, we’ll be usingsimplecov. Simplecov is a gem that can be easily integrated into a Rails app or other Ruby project, and provides a snazzy little html page that shows your test coverage.
Installation is a little bit more intense than the previous tools listed here, but is still pretty straightforward. Add the following line to your test/spec_helper and run your tests.
require 'simplecov'
SimpleCov.startcoverage/index.html and you’ll see something that looks like this:
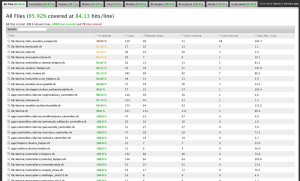 Image from simplecov’s github page.[7]
To see a highlighted version where red shows the lines not executed, you can click the file paths. And that’s basically that.
C1 (statement coverage) is what simplecov reports, and while you can’t use this information to quantify exactly how healthy your program is, you can use this overview to give you a place to start. This is especially useful for legacy applications, where you may not know yet exactly where the problem areas are.
Image from simplecov’s github page.[7]
To see a highlighted version where red shows the lines not executed, you can click the file paths. And that’s basically that.
C1 (statement coverage) is what simplecov reports, and while you can’t use this information to quantify exactly how healthy your program is, you can use this overview to give you a place to start. This is especially useful for legacy applications, where you may not know yet exactly where the problem areas are.
Let’s Recap
We looked at these:- Cyclomatic complexity– a graphical measurement of the number of possible paths through the normal flow of a program.
- Saikuro – Analyzes cyclomatic complexity and writes a nice report for evaluation.
- ABC metric– a method by which scores are gathered for each component- assignment, branching, and calls, then calculated into a score that can be easily understood.
- Flog – An opinionated and robust commandline tool that runs the ABC metric.
- Code Coverage– a measure used in software testing used to describe the degree to which the source code of a program has been tested.
- Simplecov – A nice test-coverage report tool that integrates easily into Rails and other Ruby projects.
Where to Begin
All of the tools discussed above are a good way to get started. If I were to start using code metrics today, I’d begin with Flog. There are good resources out there with information on how to get up and running with it, and I believe its opinionated nature will get you to start asking questions that you might not think about otherwise. Start by using the measurement Jake Scruggs (see above) came up with as a rule of thumb and really think about where that complexity is coming from. Once you’ve gotten a feel how Flog identifies overly complex code, move on to the other tools and begin to get a feel for how they relate. Start by building a workflow that involves code metrics. It doesn’t have to be something as complicated as a githook even. Maybe just make it a habit to run Flog before merging a branch, or run a suite of metrics before your next code review. Hopefully, this has whet your appetite for information about your code. Understanding how complexity is measured and where that complexity lives in your code is an incredible advantage for development. This article has barely even scratched the surface of code metrics. Really smart people have been working on this for decades and it shows. There are tremendous resources out there to explore all the different aspects of this study. Go and investigate. Oh, and thanks for reading. ^_^References
Special thanks to @telemachus and @pat_shaugnessy for their editing help.- Cyclomatic Complexity Revisited (infoq), Gavin Terrill, 2008
- “Structured Testing: A Testing Methodology Using the Cyclomatic Complexity Metric”, Arthur Watson,Thomas McCabe, 1996
- Saikuro Website,Zev Blut, 2005
- Applying the ABC Metric to C, C++, and Java, Jerry Fitzpatrick, 1997
- Using Metrics to Take a Look at Your Code, Jake Scruggs, 2008
- Wikipedia Code Coverage
- Simplecov
Frequently Asked Questions (FAQs) about Code Metrics
What are the key code metrics to consider for Ruby programming?
When working with Ruby programming, there are several key code metrics to consider. These include complexity metrics such as Cyclomatic Complexity, which measures the number of linearly independent paths through a program’s source code, and ABC Complexity, which measures assignments, branches, and conditions. Other important metrics include LOC (Lines of Code), which measures the size of a codebase, and churn, which measures how frequently the code is changed. These metrics can help developers understand the quality and maintainability of their code.
How can I use code metrics to improve my code quality?
Code metrics can provide valuable insights into the quality of your code. For example, high complexity metrics may indicate that your code is difficult to understand and maintain, which could lead to bugs and other issues. By identifying areas of high complexity, you can refactor your code to make it simpler and more maintainable. Similarly, high churn metrics may indicate that a particular area of your code is problematic and requires frequent changes. By focusing on these areas, you can improve the stability of your code.
What tools are available for measuring code metrics in Ruby?
There are several tools available for measuring code metrics in Ruby. These include RuboCop, a Ruby static code analyzer and formatter, and Reek, a tool that detects code smells in Ruby. Other tools include Flog, which measures code complexity, and Flay, which identifies code duplication. These tools can help you identify potential issues in your code and guide you in making improvements.
How do code metrics relate to testing?
Code metrics can provide valuable insights that can guide your testing efforts. For example, areas of high complexity or high churn may be more prone to bugs and therefore require more thorough testing. By focusing your testing efforts on these areas, you can increase the likelihood of catching and fixing bugs before they become a problem.
How can I use code metrics in a team setting?
In a team setting, code metrics can be used to establish coding standards and best practices. By agreeing on acceptable levels for various metrics, teams can ensure that their code remains consistent and maintainable. Code metrics can also be used to identify areas of the codebase that may require additional attention or resources, helping teams to allocate their efforts more effectively.
What are the limitations of code metrics?
While code metrics can provide valuable insights, they also have their limitations. For example, they can’t measure aspects of code quality such as readability or adherence to coding standards. They also can’t tell you whether your code is correct or whether it meets the requirements of your project. Therefore, while code metrics can be a useful tool, they should be used in conjunction with other methods of assessing code quality.
How can I interpret code metrics values?
Interpreting code metrics values can be complex, as the meaning of a particular value can depend on the context. For example, a high complexity metric may be acceptable for a large, complex system, but not for a small, simple one. Similarly, a high churn metric may be a sign of a problematic area of code, or it may simply reflect a part of the codebase that is under active development. Therefore, it’s important to interpret code metrics values in the context of your specific project and goals.
How can I integrate code metrics into my development process?
There are several ways to integrate code metrics into your development process. One approach is to use a tool that automatically calculates code metrics as part of your build process. This can provide immediate feedback on the impact of your changes. Another approach is to use code metrics as part of your code review process, to help identify potential issues and guide discussions about code quality.
Can code metrics help me identify technical debt?
Yes, code metrics can help identify technical debt. For example, areas of high complexity or high churn may indicate areas of the codebase that are difficult to maintain and could benefit from refactoring. By identifying and addressing these areas, you can reduce your technical debt and improve the maintainability of your code.
How can I learn more about code metrics?
There are many resources available for learning more about code metrics. These include books, online tutorials, and documentation for the various tools that measure code metrics. Additionally, many programming communities have forums and discussion groups where you can ask questions and learn from the experiences of others.
 Jonathan Jackson
Jonathan Jackson is a Ruby/Rails developer, working in Jacksonville Beach at Hashrocket. He often writes about Ruby development at his blog jonathan-jackson.net, which features articles designed to enlighten newbies and veterens alike. When he's not crunching code, he enjoys gaming, reading, and ultimate frisbee.